
 GBPUSD
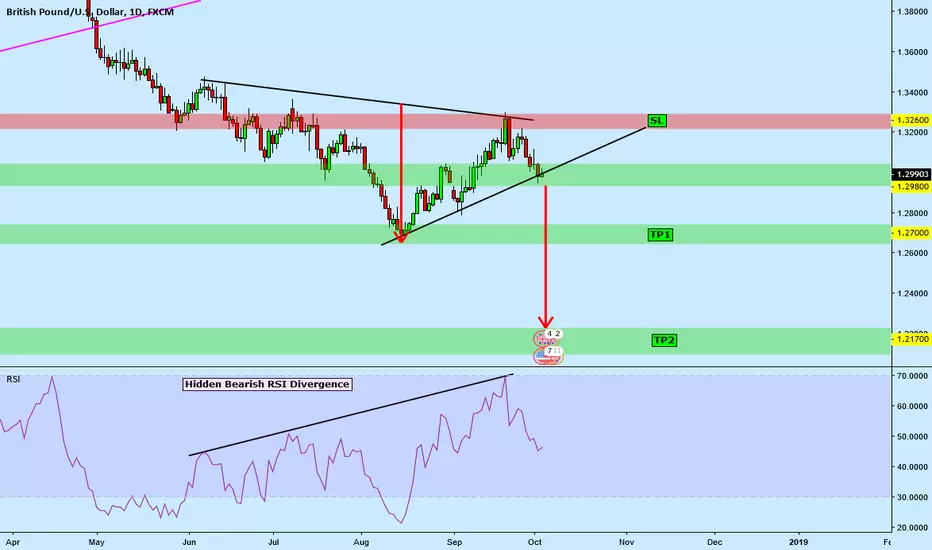
There's a Hidden RSI Bearish Divergence on the Daily Chart indicating a possible downtrend continuation.
A break below and daily candle close below the trendline and we may see price go as low as ~1.21700 ( Previous Low of March)
Short Entry: At close of Daily Candle below trendline
TP 1: 1.27000
TP 2: 1.21700
SL: 1.32600
This is longterm trade. Take profits as you wish.
Not
Not
TP 1: 1.27000 reached
Feragatname
Bilgiler ve yayınlar, TradingView tarafından sağlanan veya onaylanan finansal, yatırım, alım satım veya diğer türden tavsiye veya öneriler anlamına gelmez ve teşkil etmez. Kullanım Koşulları bölümünde daha fazlasını okuyun.
Feragatname
Bilgiler ve yayınlar, TradingView tarafından sağlanan veya onaylanan finansal, yatırım, alım satım veya diğer türden tavsiye veya öneriler anlamına gelmez ve teşkil etmez. Kullanım Koşulları bölümünde daha fazlasını okuyun.