GBP/USD Daily: Rejection Near 1.3552 Supply Zone Threatens Short-Term Bullish Structure
### 🇬🇧/🇺🇸 British Pound / U.S. Dollar (
 GBPUSD) Daily Technical Matrix (Ref: GBPUSD_2026-08-18_08-49-53.png)
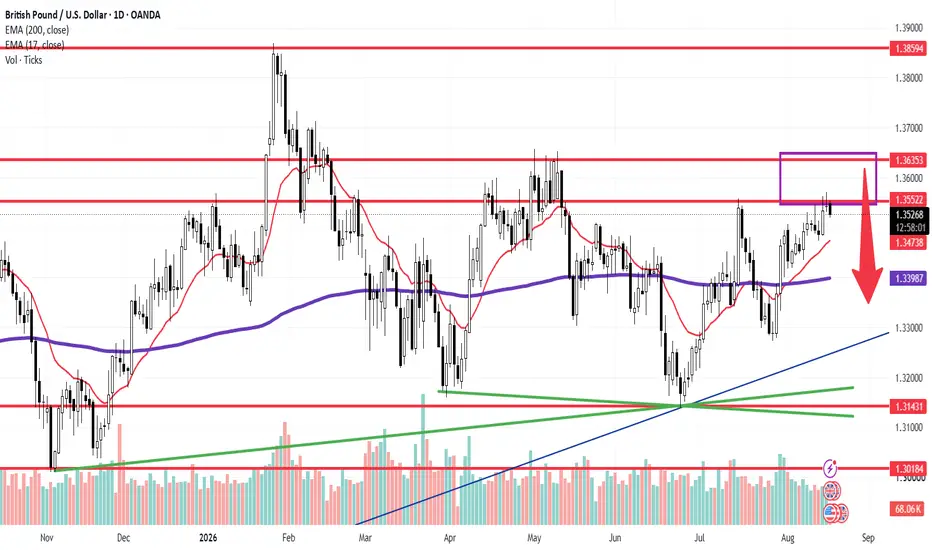
We are releasing an updated Daily (1D) structural matrix for GBP/USD (GBPUSD). Following a sustained rally from the July lows, price action has encountered immediate supply near the horizontal resistance node at **1.35522**, pointing toward a potential corrective pullback (red arrow vector) within the primary trend.
The pair is currently trading slightly lower at **1.35302 (-0.09%)**, consolidating just below the upper supply boundary.
---
### 🔍 Technical Architecture & Structural Levels:
Our quantitative setup isolates key dynamic moving averages and horizontal supply/demand zones:
1. **Supply Overhead (Highlighted Purple Zone):** The price is hesitating inside the **1.35522 – 1.36353** supply block. This region previously capped upward momentum, marking a key zone where sell-side volume is actively defending the boundary.
2. **Dynamic Moving Average Support Floor:**
* **17-Period EMA (Red Line):** **1.34742** — Serves as the immediate dynamic trailing floor for the current swing.
* **200-Period EMA (Purple Line):** **1.33987** — The macro institutional trend definition line.
3. **Macro Demand Structural Nodes:**
* **Confluent Trendline Support:** **1.31431** — Aligned with the multi-month blue ascending support line and green trendline intersection.
* **Macro Baseline Floor:** **1.30184**.
---
### 🛡️ Strategic Operational Scenarios:
* **Scenario A — Short-Term Corrective Pullback (Red Arrow):** Rejection from the **1.35522 – 1.36353** ceiling will trigger a pullback toward the dynamic **17-EMA support at 1.34742**. A deeper extension could retest the **200-EMA near 1.33987**, offering potential re-entry for medium-term buyers.
* **Scenario B — Bullish Breakout Continuation:** A decisive daily candle close above **1.36353** invalidates the bearish retracement thesis, opening a clean upside path toward major swing high resistance at **1.38594**.
### 📊 Tactical Parameters Summary:
* **Current Bias:** Neutral / Short-Term Pullback Risk
* **Primary Overhead Resistance Zone:** 1.35522 – 1.36353
* **Macro Peak Target (Scenario B Breakout):** 1.38594
* **Immediate Dynamic Support (17-EMA):** 1.34742
* **Institutional Macro Anchor (200-EMA):** 1.33987
* **Major Structural Confluence Floor:** 1.31431 / 1.30184
---
📊 **ChartPro Data**
*FX Market Architecture, Structural Supply/Demand & Systematic Risk Management.*
⚠️ **Disclaimer:** For educational and informational purposes only. This active market study represents a personal trading framework and does not constitute financial or investment advice.
### 🇬🇧/🇺🇸 British Pound / U.S. Dollar (
GBPUSD) Daily Technical Matrix (Ref: GBPUSD_2026-08-18_08-49-53.png)We are releasing an updated Daily (1D) structural matrix for GBP/USD (
GBPUSD). Following a sustained rally from the July lows, price action has encountered immediate supply near the horizontal resistance node at **1.35522**, pointing toward a potential corrective pullback (red arrow vector) within the primary trend.The pair is currently trading slightly lower at **1.35302 (-0.09%)**, consolidating just below the upper supply boundary.
---
### 🔍 Technical Architecture & Structural Levels:
Our quantitative setup isolates key dynamic moving averages and horizontal supply/demand zones:
1. **Supply Overhead (Highlighted Purple Zone):** The price is hesitating inside the **1.35522 – 1.36353** supply block. This region previously capped upward momentum, marking a key zone where sell-side volume is actively defending the boundary.
2. **Dynamic Moving Average Support Floor:**
* **17-Period EMA (Red Line):** **1.34742** — Serves as the immediate dynamic trailing floor for the current swing.
* **200-Period EMA (Purple Line):** **1.33987** — The macro institutional trend definition line.
3. **Macro Demand Structural Nodes:**
* **Confluent Trendline Support:** **1.31431** — Aligned with the multi-month blue ascending support line and green trendline intersection.
* **Macro Baseline Floor:** **1.30184**.
---
### 🛡️ Strategic Operational Scenarios:
* **Scenario A — Short-Term Corrective Pullback (Red Arrow):** Rejection from the **1.35522 – 1.36353** ceiling will trigger a pullback toward the dynamic **17-EMA support at 1.34742**. A deeper extension could retest the **200-EMA near 1.33987**, offering potential re-entry for medium-term buyers.
* **Scenario B — Bullish Breakout Continuation:** A decisive daily candle close above **1.36353** invalidates the bearish retracement thesis, opening a clean upside path toward major swing high resistance at **1.38594**.
### 📊 Tactical Parameters Summary:
* **Current Bias:** Neutral / Short-Term Pullback Risk
* **Primary Overhead Resistance Zone:** 1.35522 – 1.36353
* **Macro Peak Target (Scenario B Breakout):** 1.38594
* **Immediate Dynamic Support (17-EMA):** 1.34742
* **Institutional Macro Anchor (200-EMA):** 1.33987
* **Major Structural Confluence Floor:** 1.31431 / 1.30184
---
📊 **ChartPro Data**
*FX Market Architecture, Structural Supply/Demand & Systematic Risk Management.*
⚠️ **Disclaimer:** For educational and informational purposes only. This active market study represents a personal trading framework and does not constitute financial or investment advice.

Feragatname
Bilgiler ve yayınlar, TradingView tarafından sağlanan veya onaylanan finansal, yatırım, alım satım veya diğer türden tavsiye veya öneriler anlamına gelmez ve teşkil etmez. Kullanım Koşulları bölümünde daha fazlasını okuyun.
Feragatname
Bilgiler ve yayınlar, TradingView tarafından sağlanan veya onaylanan finansal, yatırım, alım satım veya diğer türden tavsiye veya öneriler anlamına gelmez ve teşkil etmez. Kullanım Koşulları bölümünde daha fazlasını okuyun.