

Conversation with Gemini
Looks like that movements
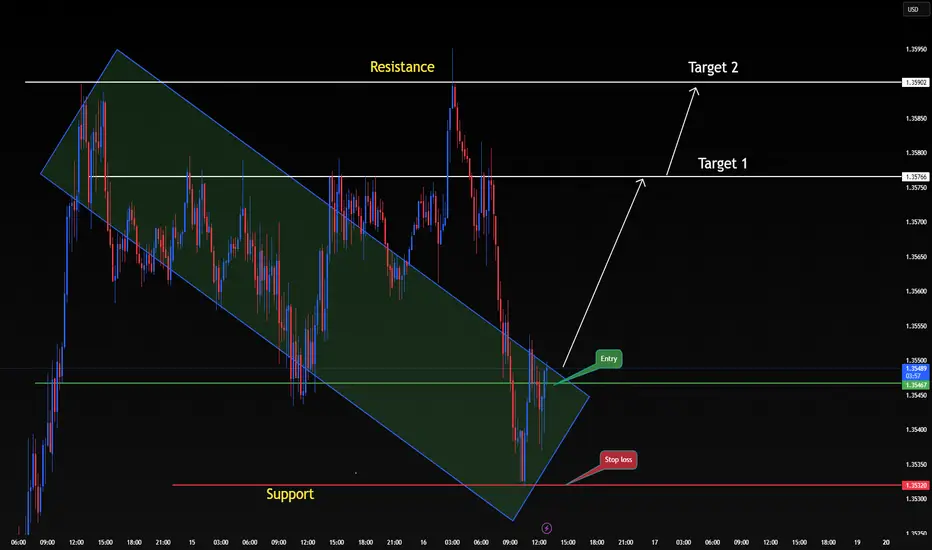
That chart shows a classic bullish breakout scenario for the GBP/USD pair. The price has been respecting a downward-sloping parallel channel for a while, but it looks like the momentum is finally shifting.
Here is a breakdown of what the setup suggests:
The Setup: Channel Breakout
The price was locked in a descending channel (the green shaded area), characterized by lower highs and lower lows. The recent movement shows price action breaking above the upper boundary of this channel, which is often a signal that the bearish trend is exhausted.
Key Levels & Strategy
Based on the annotations in the image, here is the technical roadmap:
Entry: The "Entry" point is set just above the breakout zone (around 1.3548). This confirms that buyers are stepping in to hold the price above the old resistance line.
Support & Stop Loss: There is a strong horizontal Support level marked at 1.3532. Placing a stop loss here protects the trade in case the breakout turns out to be a "fakeout" and price falls back into the channel.
Resistance & Targets:
Target 1 (1.3576): This aligns with a previous local peak and acts as the first major hurdle.
Target 2 (1.3590): This is the ultimate resistance level shown, representing a full recovery of the most recent significant drop.

İlgili yayınlar
Feragatname
Bilgiler ve yayınlar, TradingView tarafından sağlanan veya onaylanan finansal, yatırım, alım satım veya diğer türden tavsiye veya öneriler anlamına gelmez ve teşkil etmez. Kullanım Koşulları bölümünde daha fazlasını okuyun.
Feragatname
Bilgiler ve yayınlar, TradingView tarafından sağlanan veya onaylanan finansal, yatırım, alım satım veya diğer türden tavsiye veya öneriler anlamına gelmez ve teşkil etmez. Kullanım Koşulları bölümünde daha fazlasını okuyun.