
Price follows the path posted last week and even broke out of small uptrend
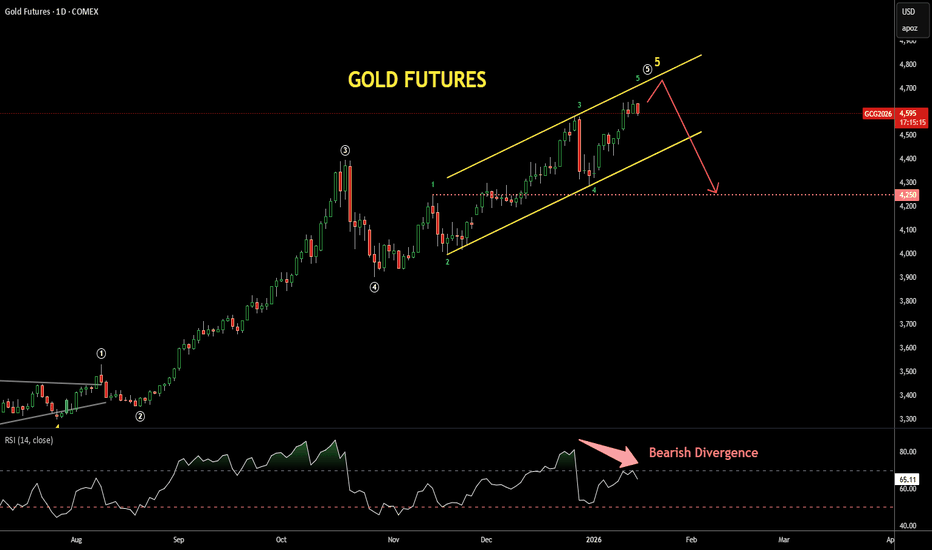
How far it can go further up?
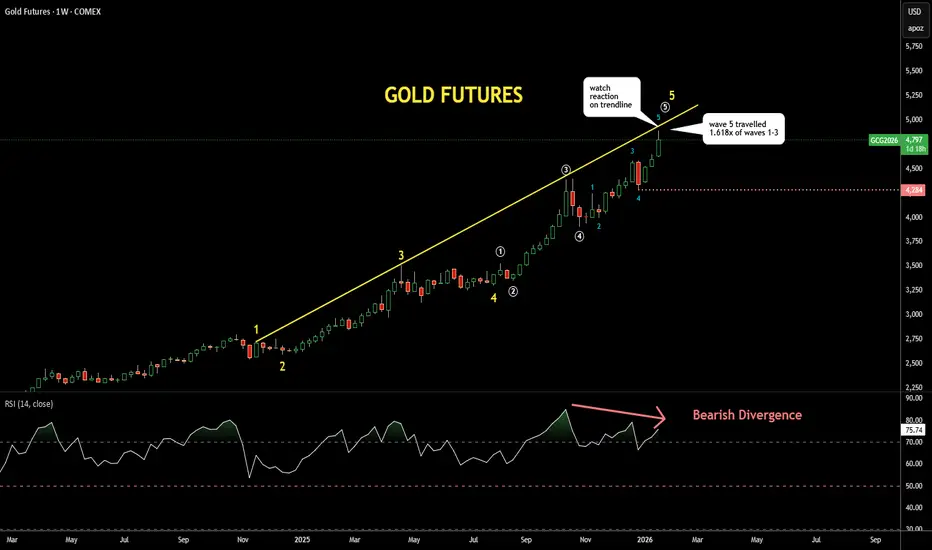
I switched to a weekly chart and added the trendline built through the peaks of waves 1 and 3
in yellow - it offers strong resistance in $4,950-5,000 area as price usually respects such large trendlines
I also checked the size of wave 5 compared to wave 1-3 distance - it reached whopping 1.618x of it compared to normal 0.618-1x
Indeed, commodities tend to have extended fifth waves and this extended size is still good
RSI on weekly as well as on daily shows Bearish Divergence, this is not the action alert but the
indicator of the final stage
Let's watch how the price reacts to the trendline as this is the only resistance at the moment
The breakdown point now is set at the bottom of the tiny wave 4 at $4,284
How far it can go further up?
I switched to a weekly chart and added the trendline built through the peaks of waves 1 and 3
in yellow - it offers strong resistance in $4,950-5,000 area as price usually respects such large trendlines
I also checked the size of wave 5 compared to wave 1-3 distance - it reached whopping 1.618x of it compared to normal 0.618-1x
Indeed, commodities tend to have extended fifth waves and this extended size is still good
RSI on weekly as well as on daily shows Bearish Divergence, this is not the action alert but the
indicator of the final stage
Let's watch how the price reacts to the trendline as this is the only resistance at the moment
The breakdown point now is set at the bottom of the tiny wave 4 at $4,284

İlgili yayınlar
Feragatname
Bilgiler ve yayınlar, TradingView tarafından sağlanan veya onaylanan finansal, yatırım, alım satım veya diğer türden tavsiye veya öneriler anlamına gelmez ve teşkil etmez. Kullanım Koşulları bölümünde daha fazlasını okuyun.
İlgili yayınlar
Feragatname
Bilgiler ve yayınlar, TradingView tarafından sağlanan veya onaylanan finansal, yatırım, alım satım veya diğer türden tavsiye veya öneriler anlamına gelmez ve teşkil etmez. Kullanım Koşulları bölümünde daha fazlasını okuyun.