
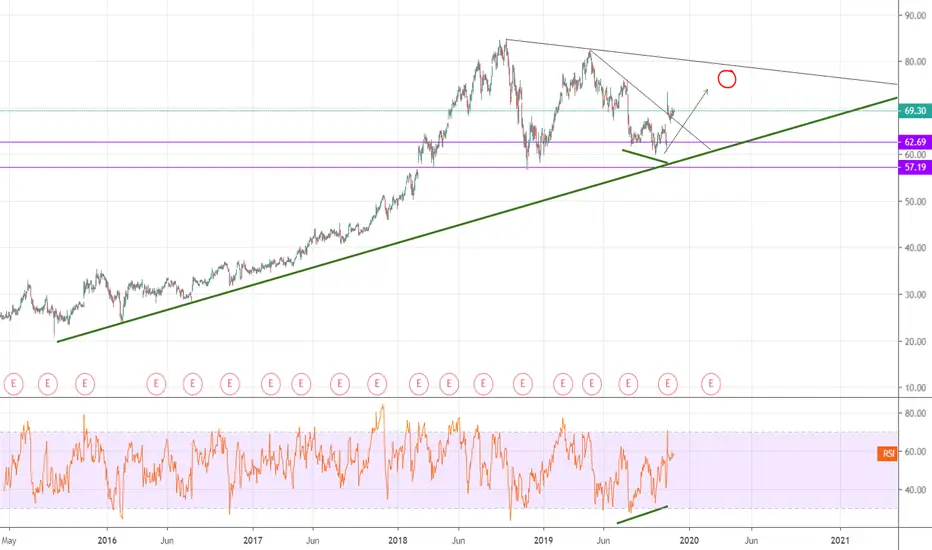
On the 1 day chart we see a Bullish Divergence appear generally indicating a reversal alongside a broken trendline, as GoDaddy announced stronger than expected financials Q3. Average analyst target price is reading $89 for 12 months. Expect resistance around $75
Not
Awaiting signal form Moving Averages, price has jumped above MA 200 line. Price may bounce off blue 13MA line, which would be short term support and could lead to another bullish signal, which we may see 'Golden Cross' signal when the gold 50MA crosses over the red 100MA.
İşlem kapandı: hedefe ulaştı

Feragatname
Bilgiler ve yayınlar, TradingView tarafından sağlanan veya onaylanan finansal, yatırım, alım satım veya diğer türden tavsiye veya öneriler anlamına gelmez ve teşkil etmez. Kullanım Koşulları bölümünde daha fazlasını okuyun.
Feragatname
Bilgiler ve yayınlar, TradingView tarafından sağlanan veya onaylanan finansal, yatırım, alım satım veya diğer türden tavsiye veya öneriler anlamına gelmez ve teşkil etmez. Kullanım Koşulları bölümünde daha fazlasını okuyun.