
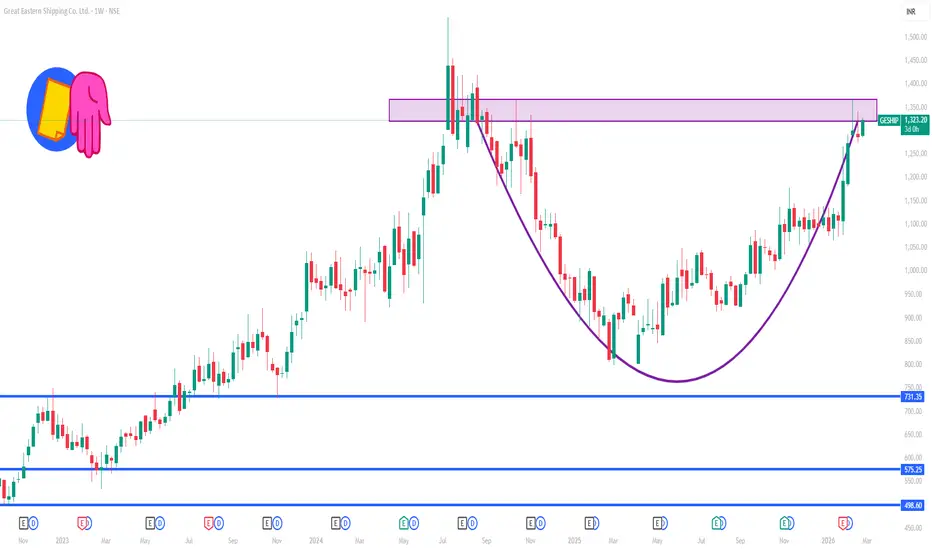
📈 1-Week Technical Levels (Approx — Updated)
🔹 Resistance Levels (Upside Targets)
R1 – ₹1,322 – ₹1,323 — First barrier near recent price action.
R2 – ₹1,344 – ₹1,345 — Next resistance on weekly movers.
R3 – ₹1,358 – ₹1,360+ — Broader supply area if momentum continues.
Higher Resistance Zone ~₹1,376 – ₹1,390 — If broader uptrend extends.
🔻 Support Levels (Downside Floors)
S1 – ₹1,286 – ₹1,287 — Immediate support close to current trading area.
S2 – ₹1,272 – ₹1,273 — Secondary support if price pulls back.
S3 – ₹1,250 – ₹1,252 — Stronger support zone if broader correction occurs.
📊 Current Market Context
RSI near ~68 suggests strength but also indicates the stock is approaching overbought near resistance.
Moving averages (20d/50d) are below current price, implying potential ongoing short-term uptrend.
Daily and weekly momentum indicators are generally bullish, supporting higher resistance levels if buyers sustain above the first few levels.
📌 How to use these levels in a 1-week view
Bullish continuation scenario: A break above R1 (~₹1,322) can open space toward R2 (~₹1,345) and then R3 (~₹1,358+).
Bearish/Correction scenario: Failing near R1–R2 can see prices revisit S1 (~₹1,286), and further down S2/S3 if weakness extends.
🔹 Resistance Levels (Upside Targets)
R1 – ₹1,322 – ₹1,323 — First barrier near recent price action.
R2 – ₹1,344 – ₹1,345 — Next resistance on weekly movers.
R3 – ₹1,358 – ₹1,360+ — Broader supply area if momentum continues.
Higher Resistance Zone ~₹1,376 – ₹1,390 — If broader uptrend extends.
🔻 Support Levels (Downside Floors)
S1 – ₹1,286 – ₹1,287 — Immediate support close to current trading area.
S2 – ₹1,272 – ₹1,273 — Secondary support if price pulls back.
S3 – ₹1,250 – ₹1,252 — Stronger support zone if broader correction occurs.
📊 Current Market Context
RSI near ~68 suggests strength but also indicates the stock is approaching overbought near resistance.
Moving averages (20d/50d) are below current price, implying potential ongoing short-term uptrend.
Daily and weekly momentum indicators are generally bullish, supporting higher resistance levels if buyers sustain above the first few levels.
📌 How to use these levels in a 1-week view
Bullish continuation scenario: A break above R1 (~₹1,322) can open space toward R2 (~₹1,345) and then R3 (~₹1,358+).
Bearish/Correction scenario: Failing near R1–R2 can see prices revisit S1 (~₹1,286), and further down S2/S3 if weakness extends.

Contact Knowledgehub for a detailed consultation: Dm on WhatsApp: [wa.link/a2o0kz]-
Phone No: [+91 93102 26243]-
Email: [tradingviewknowledgehub@gmail.com]---
-- Let’s achieve success together!
Phone No: [+91 93102 26243]-
Email: [tradingviewknowledgehub@gmail.com]---
-- Let’s achieve success together!
İlgili yayınlar
Feragatname
Bilgiler ve yayınlar, TradingView tarafından sağlanan veya onaylanan finansal, yatırım, alım satım veya diğer türden tavsiye veya öneriler anlamına gelmez ve teşkil etmez. Kullanım Koşulları bölümünde daha fazlasını okuyun.
Contact Knowledgehub for a detailed consultation: Dm on WhatsApp: [wa.link/a2o0kz]-
Phone No: [+91 93102 26243]-
Email: [tradingviewknowledgehub@gmail.com]---
-- Let’s achieve success together!
Phone No: [+91 93102 26243]-
Email: [tradingviewknowledgehub@gmail.com]---
-- Let’s achieve success together!
İlgili yayınlar
Feragatname
Bilgiler ve yayınlar, TradingView tarafından sağlanan veya onaylanan finansal, yatırım, alım satım veya diğer türden tavsiye veya öneriler anlamına gelmez ve teşkil etmez. Kullanım Koşulları bölümünde daha fazlasını okuyun.