
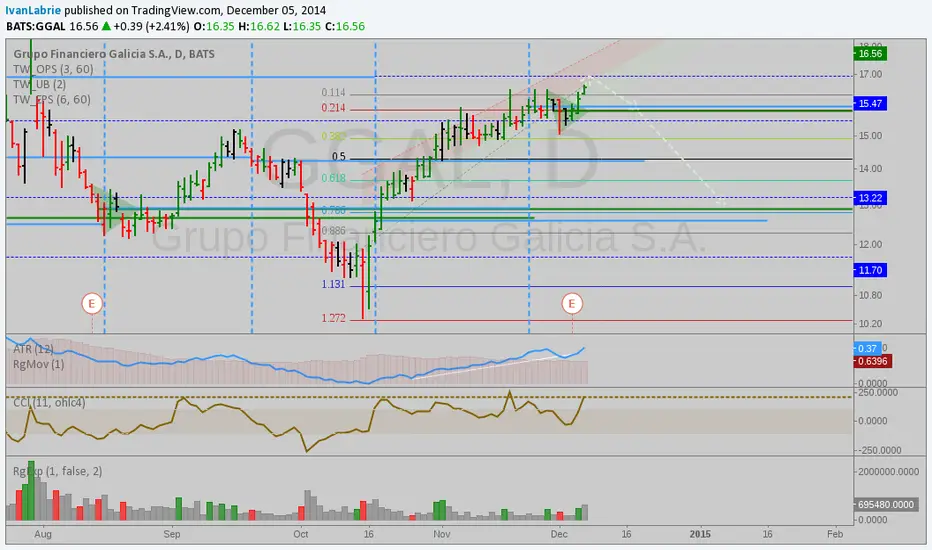
In this chart we can see that GGAL has been moving steeply up, but it's near to significant resistance levels from prior congestion areas, as well as a prolongation of the options expirations line plotted by Tim West's Key Hidden Levels indicator.
If we see price breach and close below the options and earnings line, we can expect it to hit the 0.5 and eventually 0.786 fibs in the chart.
A move below the highest low in the rally would intiate the short position, as long as we are below the resistance lines above (which is where I'd sugges placing a stop).
If we see price breach and close below the options and earnings line, we can expect it to hit the 0.5 and eventually 0.786 fibs in the chart.
A move below the highest low in the rally would intiate the short position, as long as we are below the resistance lines above (which is where I'd sugges placing a stop).
İşlem kapandı: hedefe ulaştı

Public, timestamped track record. Free month of the desk: ivanlabrie.netlify.app
Feragatname
Bilgiler ve yayınlar, TradingView tarafından sağlanan veya onaylanan finansal, yatırım, alım satım veya diğer türden tavsiye veya öneriler anlamına gelmez ve teşkil etmez. Kullanım Koşulları bölümünde daha fazlasını okuyun.
Public, timestamped track record. Free month of the desk: ivanlabrie.netlify.app
Feragatname
Bilgiler ve yayınlar, TradingView tarafından sağlanan veya onaylanan finansal, yatırım, alım satım veya diğer türden tavsiye veya öneriler anlamına gelmez ve teşkil etmez. Kullanım Koşulları bölümünde daha fazlasını okuyun.