
GMXUSDT Technical analysis update
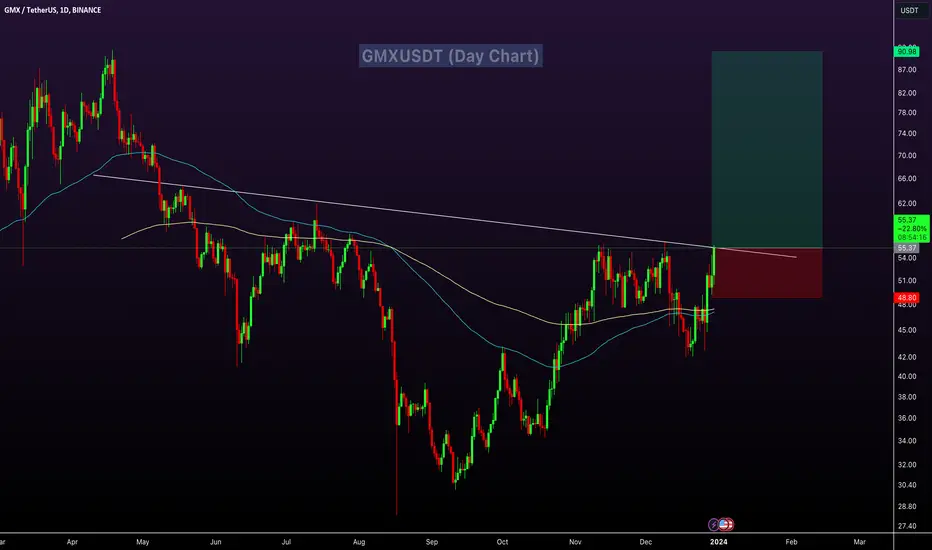
GMXUSDT has formed an inverse head and shoulder pattern on the daily chart. With the price breaking its neckline, this suggests a potential bullish signal for GMX.
Buy zone: Below $55.50
Stop loss : $48.75
Take Profit 1: $60.50
Take Profit 2: $72.00
Take Profit 3: $90.00
Thanks
Hexa
GMXUSDT has formed an inverse head and shoulder pattern on the daily chart. With the price breaking its neckline, this suggests a potential bullish signal for GMX.
Buy zone: Below $55.50
Stop loss : $48.75
Take Profit 1: $60.50
Take Profit 2: $72.00
Take Profit 3: $90.00
Thanks
Hexa

🚀Telegram : t.me/hexatrades
🌐Website: hexatrades.io/
🗣️Twitter(X): twitter.com/HexaTrades
🌐Website: hexatrades.io/
🗣️Twitter(X): twitter.com/HexaTrades
İlgili yayınlar
Feragatname
Bilgiler ve yayınlar, TradingView tarafından sağlanan veya onaylanan finansal, yatırım, alım satım veya diğer türden tavsiye veya öneriler anlamına gelmez ve teşkil etmez. Kullanım Koşulları bölümünde daha fazlasını okuyun.
🚀Telegram : t.me/hexatrades
🌐Website: hexatrades.io/
🗣️Twitter(X): twitter.com/HexaTrades
🌐Website: hexatrades.io/
🗣️Twitter(X): twitter.com/HexaTrades
İlgili yayınlar
Feragatname
Bilgiler ve yayınlar, TradingView tarafından sağlanan veya onaylanan finansal, yatırım, alım satım veya diğer türden tavsiye veya öneriler anlamına gelmez ve teşkil etmez. Kullanım Koşulları bölümünde daha fazlasını okuyun.