GOBTC Chart Analysis
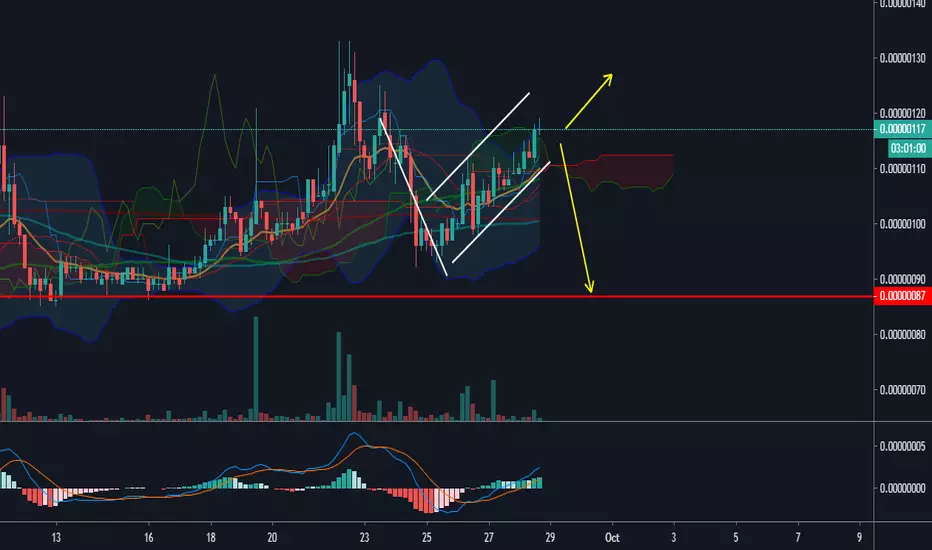
It is possible that, after a little rise, it will fall back to the support line.
Another possibility is that from the next candle, without rising, reach to the same line.
The flag pattern and the reduction of the volume of transactions in the chart are clear.
Another possibility is that from the next candle, without rising, reach to the same line.
The flag pattern and the reduction of the volume of transactions in the chart are clear.

Feragatname
Bilgiler ve yayınlar, TradingView tarafından sağlanan veya onaylanan finansal, yatırım, alım satım veya diğer türden tavsiye veya öneriler anlamına gelmez ve teşkil etmez. Kullanım Koşulları bölümünde daha fazlasını okuyun.
Feragatname
Bilgiler ve yayınlar, TradingView tarafından sağlanan veya onaylanan finansal, yatırım, alım satım veya diğer türden tavsiye veya öneriler anlamına gelmez ve teşkil etmez. Kullanım Koşulları bölümünde daha fazlasını okuyun.