From a global market perspective, investors are currently readjusting their asset allocation. On one hand, uncertainty in the Middle East is fueling risk aversion; on the other hand, rising oil prices may reignite global inflationary pressures, raising new concerns about the monetary policy path of global central banks. The gold market has gradually shifted from a simple "interest rate cut trade" to a dual-driven logic of "geopolitical risk + inflation hedging."
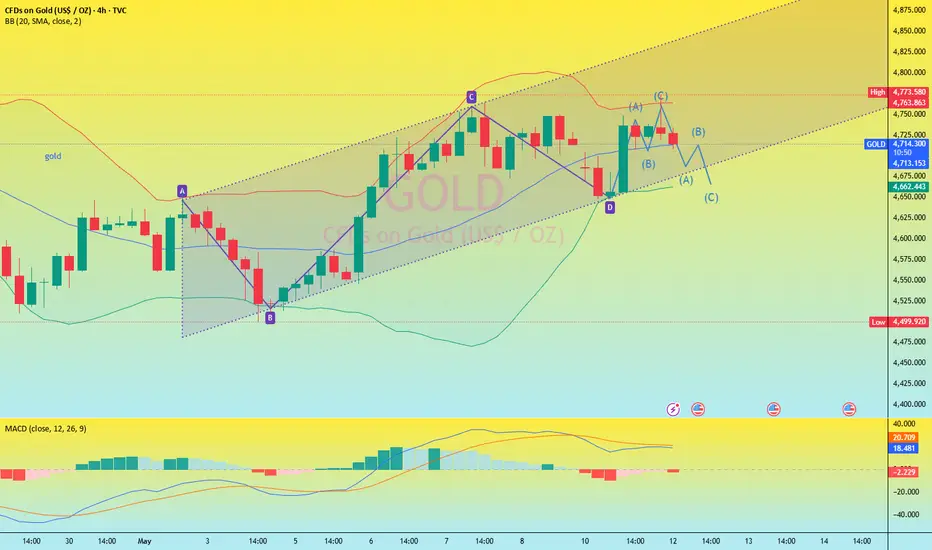
From a technical perspective, gold maintains a strong upward trend on the daily chart, with prices consistently trading above major moving averages. The MACD indicator remains high, indicating that the medium-term uptrend has not yet ended. If gold prices effectively break through the $4780 area, it is expected to further open up upward space and test $4800 or even $4850.
However, in the short term, the 4-hour chart shows weakening momentum. The RSI indicator is approaching overbought territory, indicating a slowdown in short-term buying interest. If US CPI data is significantly higher than expected, the US dollar index may strengthen again, thus putting pressure on gold in the short term.
The key support level is currently around $4,680. If this area is broken, it could trigger some long positions to take profits, leading to a further pullback to the $4,600 level.
 XAUUSD XAUUSD XAUUSD
From a technical perspective, gold maintains a strong upward trend on the daily chart, with prices consistently trading above major moving averages. The MACD indicator remains high, indicating that the medium-term uptrend has not yet ended. If gold prices effectively break through the $4780 area, it is expected to further open up upward space and test $4800 or even $4850.
However, in the short term, the 4-hour chart shows weakening momentum. The RSI indicator is approaching overbought territory, indicating a slowdown in short-term buying interest. If US CPI data is significantly higher than expected, the US dollar index may strengthen again, thus putting pressure on gold in the short term.
The key support level is currently around $4,680. If this area is broken, it could trigger some long positions to take profits, leading to a further pullback to the $4,600 level.
XAUUSD XAUUSD XAUUSD Not
Accurate trading signals are the only way to accumulate wealth. Please stay tuned or leave a message for detailed trading signals.
Feragatname
Bilgiler ve yayınlar, TradingView tarafından sağlanan veya onaylanan finansal, yatırım, alım satım veya diğer türden tavsiye veya öneriler anlamına gelmez ve teşkil etmez. Kullanım Koşulları bölümünde daha fazlasını okuyun.
Feragatname
Bilgiler ve yayınlar, TradingView tarafından sağlanan veya onaylanan finansal, yatırım, alım satım veya diğer türden tavsiye veya öneriler anlamına gelmez ve teşkil etmez. Kullanım Koşulları bölümünde daha fazlasını okuyun.