
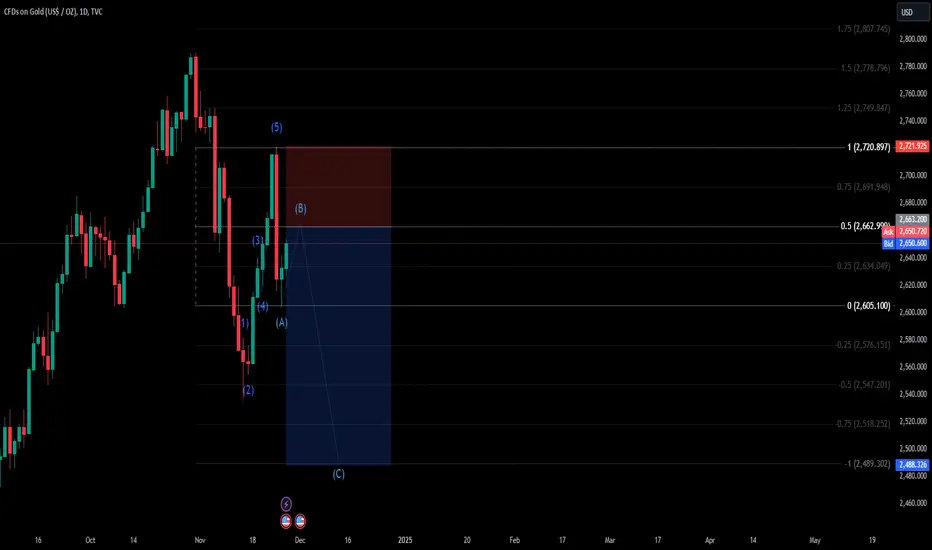
The daily XAU/USD chart reveals a completed Elliott Wave (1-5) structure, with wave (5) peaking near the $2,720 resistance level. This marks a potential reversal zone for gold prices.
Expected Corrective ABC Pattern:
Key Levels to Watch:
Trading Strategy:
Given the high sensitivity of gold prices to macroeconomic events, traders should exercise caution. Proper position sizing and setting appropriate stop-loss levels are crucial to mitigate potential risks. Monitoring upcoming economic releases and geopolitical developments is essential, as these factors can significantly impact market volatility.
Keep an eye on the evolving market conditions and adjust your trading strategy accordingly. Good luck!
Expected Corrective ABC Pattern:
- Wave A: The initial decline is anticipated to target the $2,605-$2,620 support zone.
- Wave B: A minor retracement is expected to occur, likely staying below the $2,720 resistance level.
- Wave C: The final wave may extend the decline towards the $2,560-$2,580 lower support zone.
Key Levels to Watch:
- Resistance: $2,720
- Support Zones:
- Middle support: $2,605-$2,620
- Lower support: $2,560-$2,580
Trading Strategy:
Given the high sensitivity of gold prices to macroeconomic events, traders should exercise caution. Proper position sizing and setting appropriate stop-loss levels are crucial to mitigate potential risks. Monitoring upcoming economic releases and geopolitical developments is essential, as these factors can significantly impact market volatility.
Keep an eye on the evolving market conditions and adjust your trading strategy accordingly. Good luck!
Not
View in H1 time frame: 
İlgili yayınlar
Feragatname
Bilgiler ve yayınlar, TradingView tarafından sağlanan veya onaylanan finansal, yatırım, alım satım veya diğer türden tavsiye veya öneriler anlamına gelmez ve teşkil etmez. Kullanım Koşulları bölümünde daha fazlasını okuyun.
İlgili yayınlar
Feragatname
Bilgiler ve yayınlar, TradingView tarafından sağlanan veya onaylanan finansal, yatırım, alım satım veya diğer türden tavsiye veya öneriler anlamına gelmez ve teşkil etmez. Kullanım Koşulları bölümünde daha fazlasını okuyun.