
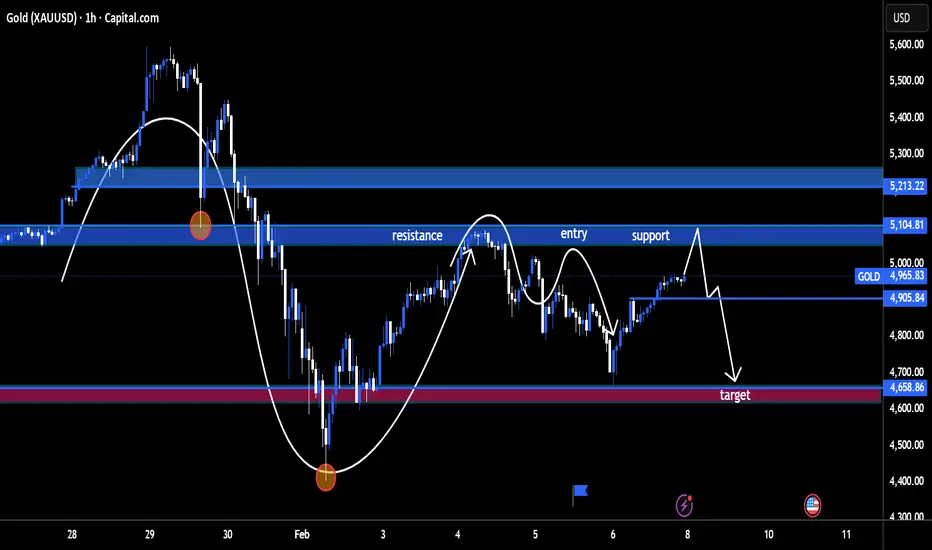
Here’s a clean breakdown of what this chart is saying 👇
Market Structure
Gold is still in a broader bearish structure.
We saw a strong impulsive sell-off, followed by a corrective bounce (classic dead-cat / pullback move).
The white curved paths you marked show lower highs forming, which keeps sellers in control.
🧱 Key Zones
Major Resistance Zone: ~5,105 – 5,213
This area previously acted as support → broke down → now acting as supply.
Entry / Minor Resistance: ~5,000 – 5,050
Price is currently reacting here. This is where sellers are expected to step in.
Near-Term Support: ~4,905
A minor reaction level, but not strong enough to flip trend.
Primary Target / Demand Zone: ~4,658
Strong historical demand + prior reaction low. Logical downside objective.
📉 Price Action Read
The bounce from ~4,700 looks corrective, not impulsive.
Momentum weakens as price approaches resistance → bearish continuation likely.
The projected spike above resistance followed by a sharp drop suggests liquidity grab before the sell-off.
🎯 Trade Bias (Based on the Chart)
Bias: Bearish
Ideal Play:
Sell rejection from 5,000 – 5,100
Confirmation via bearish candles / lower-timeframe rejection
Target: 4,660 demand zone
Invalidation: Clean acceptance above ~5,213
🧠 Big Picture Takeaway
This is a pullback into resistance within a downtrend, not a trend reversal. Unless gold reclaims and holds above the upper resistance zone, rallies are likely selling opportunities, not buys.
İşlem aktif

Feragatname
Bilgiler ve yayınlar, TradingView tarafından sağlanan veya onaylanan finansal, yatırım, alım satım veya diğer türden tavsiye veya öneriler anlamına gelmez ve teşkil etmez. Kullanım Koşulları bölümünde daha fazlasını okuyun.
Feragatname
Bilgiler ve yayınlar, TradingView tarafından sağlanan veya onaylanan finansal, yatırım, alım satım veya diğer türden tavsiye veya öneriler anlamına gelmez ve teşkil etmez. Kullanım Koşulları bölümünde daha fazlasını okuyun.