
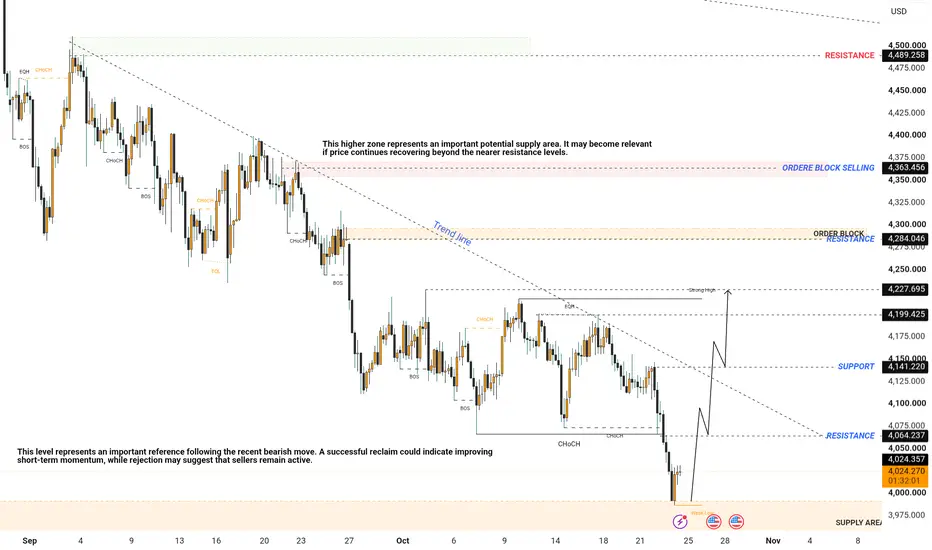
Gold (XAUUSD) Analysis | Liquidity Sweep, Market Structure & Potential Bullish Retracement
This analysis focuses on the current Gold (XAUUSD) price structure, highlighting liquidity, Break of Structure (BOS), Change of Character (CHoCH), order blocks, trend-line resistance, and potential reversal areas.
Gold has been trading within a broader bearish structure, forming lower highs and lower lows after repeated rejections from higher price levels. The recent bearish displacement has pushed price below several important structural levels, indicating that sellers have maintained control of the market.
Price is now approaching the marked lower support and liquidity region around 4,000–4,030, where a potential reaction may develop. However, a reaction from this area alone would not confirm a complete trend reversal. Further confirmation from price action and market structure remains essential.
Liquidity Sweep & Current Support
The recent decline has brought price toward the lower liquidity zone, where previous lows may attract additional selling pressure or trigger a liquidity sweep.
This area is important because a sweep followed by strong bullish displacement could indicate that sellers are losing short-term momentum and buyers are beginning to participate.
If price holds the lower zone and forms a bullish Change of Character (CHoCH), a corrective recovery toward nearby resistance levels may become possible.
Conversely, a decisive breakdown below the support zone, followed by continued bearish acceptance, would weaken the bullish recovery scenario and could expose price to further downside.
Market Structure & Trend Line
The chart continues to show a bearish structural sequence, with multiple BOS and CHoCH markings reflecting changes in short-term price behavior.
A descending trend line also acts as an important resistance reference. Price would need to break above this trend line and establish stronger bullish structure to support the possibility of a more meaningful recovery.
A simple trend-line break is not sufficient on its own. Strong displacement, a confirmed structural shift, and successful retests would provide additional evidence that momentum may be changing.
Potential Bullish Scenario
The projected path illustrates a possible corrective recovery from the current support and liquidity region.
If price reacts positively around 4,000–4,030, establishes a higher low, and breaks above nearby internal resistance, the first important level to monitor would be approximately 4,057.
A sustained move above this level could open the way toward 4,140, which represents another important structural reference and potential resistance area.
If bullish momentum continues and price breaks through the intermediate resistance, the next potential objective would be the 4,200–4,228 region, where previous highs and liquidity references are marked.
This recovery scenario remains conditional on confirmation. The projected path is not a guarantee that price will reach these levels.
Key Order Blocks & Resistance Zones
1. 4,057 — Immediate Structural Resistance
This level represents an important reference following the recent bearish move. A successful reclaim could indicate improving short-term momentum, while rejection may suggest that sellers remain active.
2. 4,140 — Intermediate Resistance
This area aligns with a marked structural level and the descending trend-line region. Price behavior around this level may help determine whether the recovery has sufficient strength to continue.
3. 4,200–4,228 — Target and Previous High Region
This zone contains previous price highs and liquidity references. If price develops sustained bullish structure, the area could become a potential retracement objective and a place to monitor for renewed selling pressure.
4. 4,275–4,285 — Major Order Block and Resistance
This higher zone represents an important potential supply area. It may become relevant if price continues recovering beyond the nearer resistance levels.
5. 4,350–4,365 — Higher Selling Order Block
This is a further resistance region on the chart. A move toward it would require significant recovery from the current price area and should not be assumed without confirmation.
Bearish Continuation Scenario
Although the chart illustrates a potential bullish retracement, the broader structure remains bearish.
If price fails to hold the current support region and continues making lower lows, the projected recovery would become less likely. In that case, the market could continue searching for lower liquidity before a more substantial reversal develops.
For this reason, the lower support zone should be evaluated through price action rather than treated as a guaranteed reversal point.
Confirmation & Risk Management
Before considering either direction, I would monitor:
- Liquidity sweep around the recent lows.
- Bullish or bearish displacement.
- Confirmed BOS or CHoCH.
- Formation of higher highs and higher lows for a bullish shift.
- Rejection or acceptance around the marked resistance zones.
- A clear invalidation level before considering any trade.
Risk management remains essential. Position size should be appropriate for the account, and potential losses should be defined before entering a position. Avoid entering solely because price reaches a marked zone.
Conclusion
Gold is currently trading near a significant lower support and liquidity region following an extended bearish move. The main question is whether this area produces a confirmed bullish reaction or whether sellers continue pushing price lower.
A successful reaction around 4,000–4,030, followed by a structural shift, could create a potential recovery toward 4,057, then 4,140, and eventually 4,200–4,228.
However, if support fails and bearish momentum continues, the bullish scenario would need to be reassessed.
The analysis is based on market structure, liquidity, and technical reaction zones. All projected movements remain conditional, and future price action will determine which scenario develops.
Disclaimer: This publication is for educational and technical-analysis purposes only and does not constitute financial advice. Market conditions can change rapidly. Always conduct your own research and apply disciplined risk management.

Join my telegram daily signal 90% accurate
t.me/+CcKfRimfqMxiOWRk
Join my Telegram
t.me/+-af0b-qg4l41ZWI8
t.me/+CcKfRimfqMxiOWRk
Join my Telegram
t.me/+-af0b-qg4l41ZWI8
Feragatname
Bilgiler ve yayınlar, TradingView tarafından sağlanan veya onaylanan finansal, yatırım, alım satım veya diğer türden tavsiye veya öneriler anlamına gelmez ve teşkil etmez. Kullanım Koşulları bölümünde daha fazlasını okuyun.