
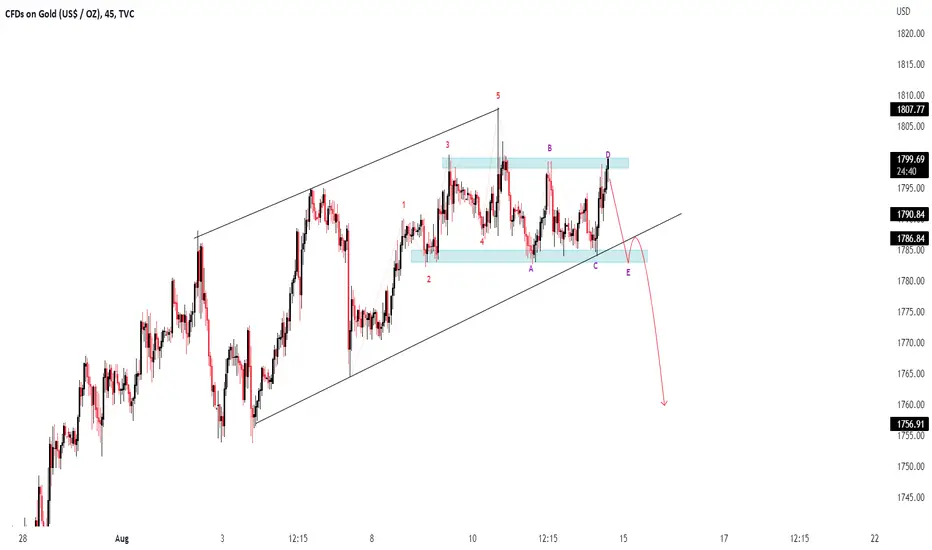
XAU/USD ( Gold / U.S Dollar ) Technical Analysis Chart Update
Time Frame - M45
According to the Pattern in Short Time Frame #STF ( #Bullish Channel ) it failed to Break the Strong Resistance Level #1798-9
According to Elliot waves it has completed the Impulsive #12345 waves and its now Following Corrective wave #ABCDE it will follow Sell Trend to complete its " E " wave
If it Breaks the Lower Trend Line #LTL and Retest it will follow More Sell

Feragatname
Bilgiler ve yayınlar, TradingView tarafından sağlanan veya onaylanan finansal, yatırım, alım satım veya diğer türden tavsiye veya öneriler anlamına gelmez ve teşkil etmez. Kullanım Koşulları bölümünde daha fazlasını okuyun.
Feragatname
Bilgiler ve yayınlar, TradingView tarafından sağlanan veya onaylanan finansal, yatırım, alım satım veya diğer türden tavsiye veya öneriler anlamına gelmez ve teşkil etmez. Kullanım Koşulları bölümünde daha fazlasını okuyun.