
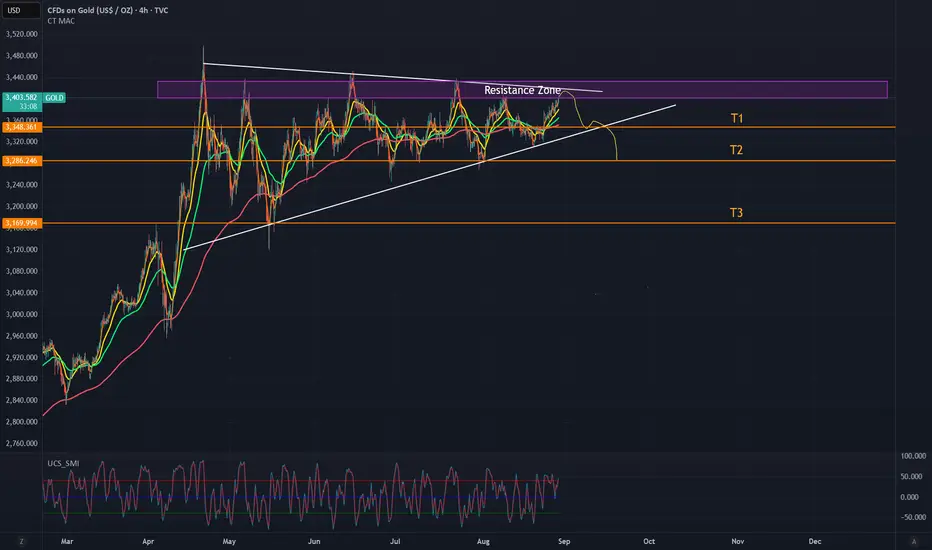
Gold is currently trading around $3,405 and moving directly into a strong resistance zone between $3400 – $3450. Price is entering a Reversal Zone around that price range, where previous attempts to break higher have failed multiple times.
The structure shows that gold is testing the upper resistance line again, while momentum indicators are already showing signs of exhaustion. If price rejects this area, I expect a potential move down to the following targets:
Target 1 (T1): $3,348
Target 2 (T2): $3,286
Target 3 (T3): $3,169
Stop Loss (SL): Above $3,450
If price breaks above this level with strong volume, the setup becomes invalid.
Summary:
I expect a rejection around the resistance zone and a potential pullback towards lower support levels. If the the resistance zone holds, this setup offers a good risk-reward ratio to the downside.
No financial advice – just my personal trade idea based on my chart.
The structure shows that gold is testing the upper resistance line again, while momentum indicators are already showing signs of exhaustion. If price rejects this area, I expect a potential move down to the following targets:
Target 1 (T1): $3,348
Target 2 (T2): $3,286
Target 3 (T3): $3,169
Stop Loss (SL): Above $3,450
If price breaks above this level with strong volume, the setup becomes invalid.
Summary:
I expect a rejection around the resistance zone and a potential pullback towards lower support levels. If the the resistance zone holds, this setup offers a good risk-reward ratio to the downside.
No financial advice – just my personal trade idea based on my chart.
İşlem aktif
Trade opened - Entry 3410. It's showing weakness now, can't imagine that it goes way higher Not
In August 2024 we witnessed something highly unusual in the markets:Gold and U.S. equities, normally moving in opposite directions, showed an extremely high positive correlation of 0.92 – one of the strongest on record.
This means that instead of acting as a safe haven when stocks sold off, gold actually moved in the same direction as the Nasdaq and S&P 500.
Historically, such extreme correlations have always been temporary, normalizing within weeks back to near zero or even negative.
My view:
We could see a repeat of this anomaly in August/September 2025. If that happens again, it may signal a turning point where one of the assets (likely tech stocks) breaks away sharply while gold resumes its hedge role.
This setup could offer massive opportunities for traders who spot the divergence early.
İşlem kapandı: durdurma seviyesi
Stopped Out. Gold Strong. Never trade things short if they are over all Moving Averages :D
Feragatname
Bilgiler ve yayınlar, TradingView tarafından sağlanan veya onaylanan finansal, yatırım, alım satım veya diğer türden tavsiye veya öneriler anlamına gelmez ve teşkil etmez. Kullanım Koşulları bölümünde daha fazlasını okuyun.
Feragatname
Bilgiler ve yayınlar, TradingView tarafından sağlanan veya onaylanan finansal, yatırım, alım satım veya diğer türden tavsiye veya öneriler anlamına gelmez ve teşkil etmez. Kullanım Koşulları bölümünde daha fazlasını okuyun.