
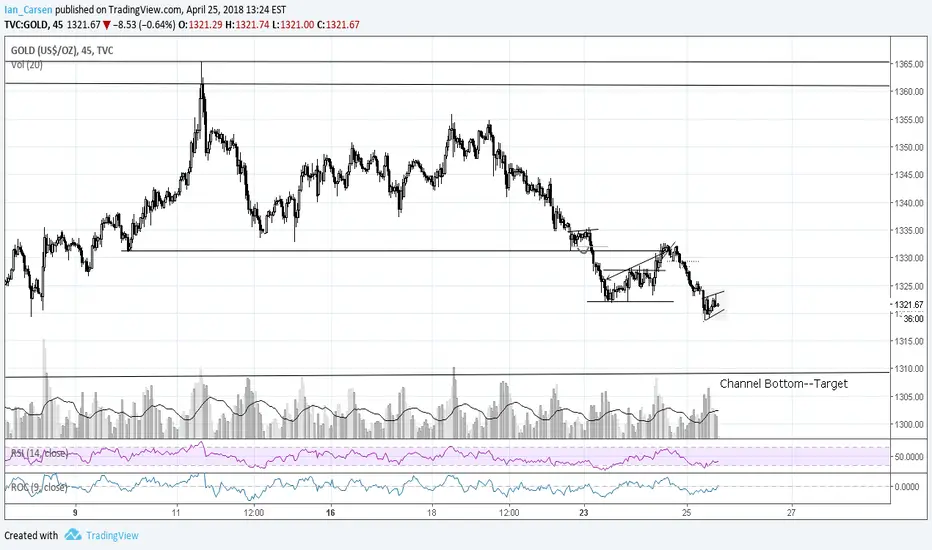
With recent dollar strength and treasury weakness, commodities are taking the hit. Here we have a classic bear flag in Gold A longer-term chart shows Gold in a large rectangular consolidation inside an ascending triangle (triangle on the weekly chart). A break of the bear flag should take price to the boundary of the larger rectangular consolidation, where price may proceed (probably after a partial rise) to fall to the boundary of the triangle, where I would expect it to reverse upwards, however, continuation of the downwards action is always possible.
Good trading and good luck!
Good trading and good luck!

Feragatname
Bilgiler ve yayınlar, TradingView tarafından sağlanan veya onaylanan finansal, yatırım, alım satım veya diğer türden tavsiye veya öneriler anlamına gelmez ve teşkil etmez. Kullanım Koşulları bölümünde daha fazlasını okuyun.
Feragatname
Bilgiler ve yayınlar, TradingView tarafından sağlanan veya onaylanan finansal, yatırım, alım satım veya diğer türden tavsiye veya öneriler anlamına gelmez ve teşkil etmez. Kullanım Koşulları bölümünde daha fazlasını okuyun.