
Amid Recurring Tensions in the Middle East: How to Position for Gold
From a technical perspective, the daily chart structure indicates that the RSI has retreated from overbought territory, signaling a weakening of bullish momentum. Gold prices are currently exhibiting a pattern of high-level consolidation with a bearish bias. Key resistance levels are situated in the $4,751 to $4,789 range, while support is concentrated around $4,621 and $4,587.
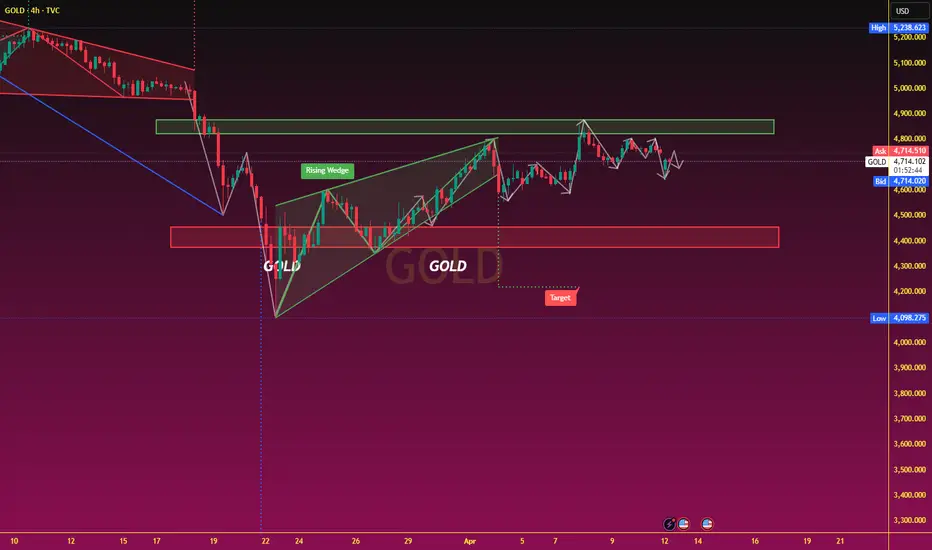
On the 4-hour timeframe, gold's short-term trajectory displays a pattern of choppy decline; notably, a price gap formed earlier has failed to close quickly, suggesting that selling pressure from above remains persistent. Should the price break below the $4,600 support level, it could proceed to test the $4,550 zone; conversely, if it manages to firmly re-establish itself above $4,750, it holds the potential to reverse its recent short-term decline and close the aforementioned gap.
From a technical perspective, the daily chart structure indicates that the RSI has retreated from overbought territory, signaling a weakening of bullish momentum. Gold prices are currently exhibiting a pattern of high-level consolidation with a bearish bias. Key resistance levels are situated in the $4,751 to $4,789 range, while support is concentrated around $4,621 and $4,587.
On the 4-hour timeframe, gold's short-term trajectory displays a pattern of choppy decline; notably, a price gap formed earlier has failed to close quickly, suggesting that selling pressure from above remains persistent. Should the price break below the $4,600 support level, it could proceed to test the $4,550 zone; conversely, if it manages to firmly re-establish itself above $4,750, it holds the potential to reverse its recent short-term decline and close the aforementioned gap.

Feragatname
Bilgiler ve yayınlar, TradingView tarafından sağlanan veya onaylanan finansal, yatırım, alım satım veya diğer türden tavsiye veya öneriler anlamına gelmez ve teşkil etmez. Kullanım Koşulları bölümünde daha fazlasını okuyun.
Feragatname
Bilgiler ve yayınlar, TradingView tarafından sağlanan veya onaylanan finansal, yatırım, alım satım veya diğer türden tavsiye veya öneriler anlamına gelmez ve teşkil etmez. Kullanım Koşulları bölümünde daha fazlasını okuyun.