Satış
GOLD
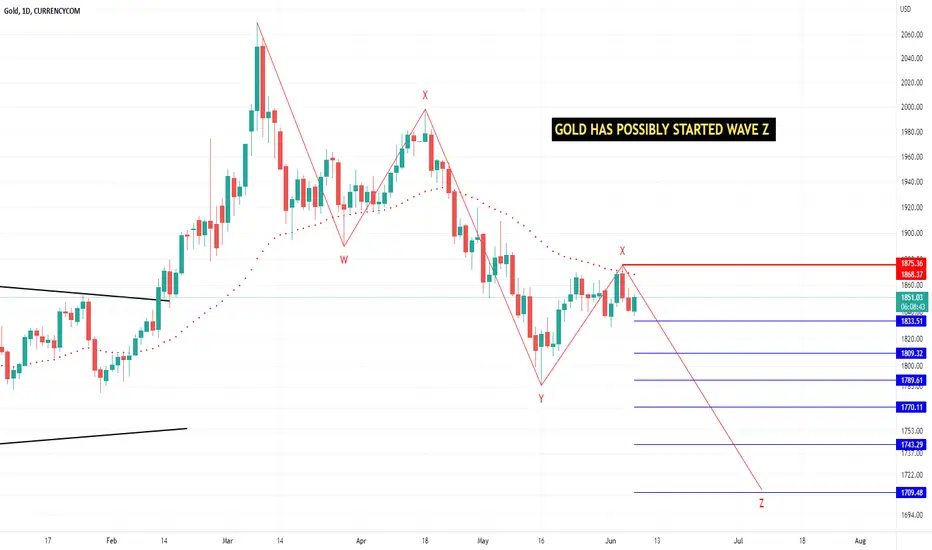
While correction gold's recent bounce rejected from RK's stop line along with upper bollinger band on daily time frame, as per wave structure we had marked it as wave X, Overall wave structure is still suggesting corrective phase only, along with trend indicator's support as a same bias by macd on multi time frame, stochastic on daily time frame, RK's momentum and also Dollar index resumes its rally, so Gold can see its slide to south direction near $1710, where wave Z can be equal to wave W. Once price closes below 20DMA which is pegged at $1842, then bear strength can show more power.
Gold has possibly started its wave Z

On daily chart histogram is decreasing

Weekly macd is already in negative way

Monthly macd is also in negative

Daily stochastic negative crossover

RK's momentum also not sustaining positive on daily chart

Most investors treat trading as a hobby because they have a full-time job doing something else.
However, If you treat trading like a business, it will pay you like a business.
If you treat like a hobby, hobbies don't pay, they cost you...!
Disclaimer.
I am not sebi registered analyst.
My studies are for educational purpose only.
Please Consult your financial advisor before trading or investing.
I am not responsible for any kinds of your profits and your losses.
Gold has possibly started its wave Z
On daily chart histogram is decreasing
Weekly macd is already in negative way
Monthly macd is also in negative
Daily stochastic negative crossover
RK's momentum also not sustaining positive on daily chart
Most investors treat trading as a hobby because they have a full-time job doing something else.
However, If you treat trading like a business, it will pay you like a business.
If you treat like a hobby, hobbies don't pay, they cost you...!
Disclaimer.
I am not sebi registered analyst.
My studies are for educational purpose only.
Please Consult your financial advisor before trading or investing.
I am not responsible for any kinds of your profits and your losses.
Not
Gold update as per wave structure seen in hourly chart
YouTube: youtube.com/@rk_charts
Telegram : t.me/RK_Charts
Twitter : @charts_rk
Email : rkcharts@gmail. com
Disclaimer.
I am not sebi registered analyst.
My studies are for educational purpose only.
Telegram : t.me/RK_Charts
Twitter : @charts_rk
Email : rkcharts@gmail. com
Disclaimer.
I am not sebi registered analyst.
My studies are for educational purpose only.
İlgili yayınlar
Feragatname
Bilgiler ve yayınlar, TradingView tarafından sağlanan veya onaylanan finansal, yatırım, alım satım veya diğer türden tavsiye veya öneriler anlamına gelmez ve teşkil etmez. Kullanım Koşulları bölümünde daha fazlasını okuyun.