
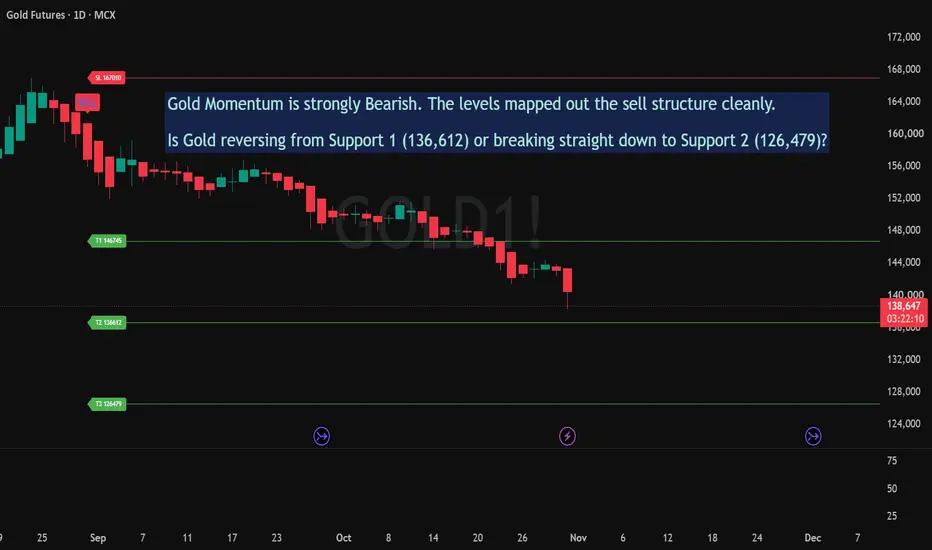
The chart shows a SELL signal followed by a sustained downward price move. Gold momentum remains bearish, with price trading near 138,600 and approaching the T2 reference level.
Chart reference levels:
Entry reference: As indicated by the SELL label
Stop-loss level: 167,010
Target 1: 146,745
Target 2: 136,612
Target 3: 126,479
These are indicator-generated reference levels for technical analysis, not predictions or guaranteed outcomes. Price may move in either direction, and the setup can fail.
Key observation: Will Gold find support near T2 (136,612), or continue its downward move towards T3 (126,479)? Watch how the candles develop and assess the setup against your own trading plan and risk limits.
Disclaimer: This post is for educational and informational purposes only. It is not a recommendation to buy, sell, or hold any security or derivative. No returns are assured. Trading involves risk; please do your own research and consult a SEBI-registered investment adviser where appropriate.
Chart reference levels:
Entry reference: As indicated by the SELL label
Stop-loss level: 167,010
Target 1: 146,745
Target 2: 136,612
Target 3: 126,479
These are indicator-generated reference levels for technical analysis, not predictions or guaranteed outcomes. Price may move in either direction, and the setup can fail.
Key observation: Will Gold find support near T2 (136,612), or continue its downward move towards T3 (126,479)? Watch how the candles develop and assess the setup against your own trading plan and risk limits.
Disclaimer: This post is for educational and informational purposes only. It is not a recommendation to buy, sell, or hold any security or derivative. No returns are assured. Trading involves risk; please do your own research and consult a SEBI-registered investment adviser where appropriate.

Feragatname
Bilgiler ve yayınlar, TradingView tarafından sağlanan veya onaylanan finansal, yatırım, alım satım veya diğer türden tavsiye veya öneriler anlamına gelmez ve teşkil etmez. Kullanım Koşulları bölümünde daha fazlasını okuyun.
Feragatname
Bilgiler ve yayınlar, TradingView tarafından sağlanan veya onaylanan finansal, yatırım, alım satım veya diğer türden tavsiye veya öneriler anlamına gelmez ve teşkil etmez. Kullanım Koşulları bölümünde daha fazlasını okuyun.