
**1. Key Observation**
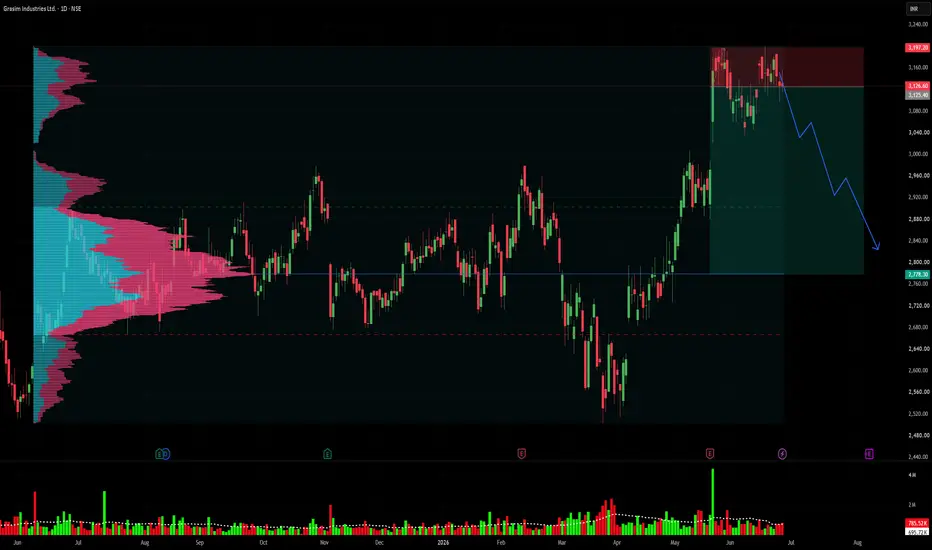
GRASIM looks weak near the upper resistance zone. Price is struggling around **₹3,126–₹3,197**, and the structure suggests that a short-term downtrend may be starting.
**2. My View**
My view is bearish as long as GRASIM stays below **₹3,197**. The stock may enter a correction phase and move lower in the coming weeks.
**3. Invalidation**
This bearish study becomes invalid if GRASIM breaks **₹3,197** and gives a daily close above it.
**4. Risk-Reward**
Risk is limited above **₹3,197**, while downside potential is towards **₹2,778**, so the setup looks favorable for a short-side study.
**5. Target Point / Range**
Target zone: **₹2,778**
**6. Why It’s Good for Short**
This setup is good for short because price is near resistance, upside is limited unless ₹3,197 breaks, and the chart shows early signs of downside continuation.
**7. Time Period**
This is a **3-month correction view** on the daily chart.
I am not a SEBI-registered analyst. This idea is shared purely for educational and study purposes. Please do your own analysis before taking any trades.
#GRASIM #Grasim #PriceAction #VolumeProfile #SwingTrading #IndianStockMarket
GRASIM looks weak near the upper resistance zone. Price is struggling around **₹3,126–₹3,197**, and the structure suggests that a short-term downtrend may be starting.
**2. My View**
My view is bearish as long as GRASIM stays below **₹3,197**. The stock may enter a correction phase and move lower in the coming weeks.
**3. Invalidation**
This bearish study becomes invalid if GRASIM breaks **₹3,197** and gives a daily close above it.
**4. Risk-Reward**
Risk is limited above **₹3,197**, while downside potential is towards **₹2,778**, so the setup looks favorable for a short-side study.
**5. Target Point / Range**
Target zone: **₹2,778**
**6. Why It’s Good for Short**
This setup is good for short because price is near resistance, upside is limited unless ₹3,197 breaks, and the chart shows early signs of downside continuation.
**7. Time Period**
This is a **3-month correction view** on the daily chart.
I am not a SEBI-registered analyst. This idea is shared purely for educational and study purposes. Please do your own analysis before taking any trades.
#GRASIM #Grasim #PriceAction #VolumeProfile #SwingTrading #IndianStockMarket

I am not a SEBI-registered analyst. This post is only for educational study, not a buy/sell recommendation. Please do your own analysis, follow risk management, and consult a certified advisor if needed.
Feragatname
Bilgiler ve yayınlar, TradingView tarafından sağlanan veya onaylanan finansal, yatırım, alım satım veya diğer türden tavsiye veya öneriler anlamına gelmez ve teşkil etmez. Kullanım Koşulları bölümünde daha fazlasını okuyun.
I am not a SEBI-registered analyst. This post is only for educational study, not a buy/sell recommendation. Please do your own analysis, follow risk management, and consult a certified advisor if needed.
Feragatname
Bilgiler ve yayınlar, TradingView tarafından sağlanan veya onaylanan finansal, yatırım, alım satım veya diğer türden tavsiye veya öneriler anlamına gelmez ve teşkil etmez. Kullanım Koşulları bölümünde daha fazlasını okuyun.