
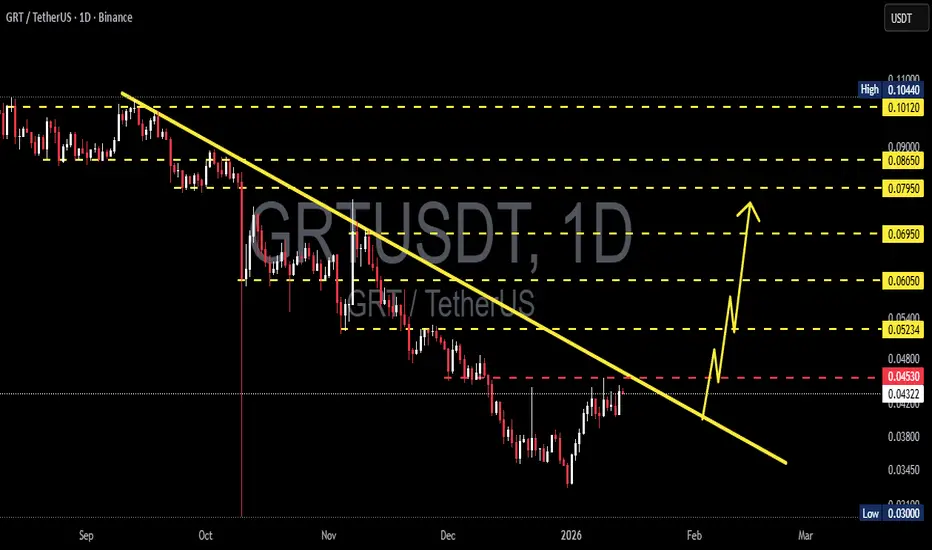
🔍 Market Structure & General Condition
On the Daily (1D) timeframe, GRT/USDT remains in a clear bearish market structure, characterized by:
Consistent Lower Highs and Lower Lows
Price trading below a descending trendline (yellow line)
Sellers still controlling the market despite a short-term rebound
The descending trendline acts as a major dynamic resistance, rejecting price multiple times in the past.
---
📐 Technical Pattern Explanation
🔻 Descending Trendline / Bearish Trend Structure
The yellow diagonal line represents a valid descending trendline formed from previous swing highs.
As long as price fails to break and close above this trendline, the overall bias remains bearish.
The current upward movement is still considered a pullback within a downtrend, not a confirmed trend reversal.
---
🟡 Key Support & Resistance Levels
Resistance Zones (Supply Areas):
0.04530 – 0.04800 → nearest resistance & rejection zone
0.05234
0.06050
0.06950
0.07950 – 0.08650
0.10120 – 0.10440 (major resistance / range high)
Support Zones (Demand Areas):
0.04322 (current minor support)
0.03800
0.03450
0.03000 → major low / strong demand zone
---
🚀 Bullish Scenario
The bullish scenario becomes valid only with confirmation:
1. Price breaks and closes above the descending trendline
2. Supported by increasing volume
3. Price holds above 0.04530 – 0.04800
🎯 Bullish Upside Targets:
0.05234
0.06050
0.06950
0.07950
0.08650
➡️ A confirmed breakout would signal a medium-term trend reversal from bearish to bullish.
---
🐻 Bearish Scenario
The bearish scenario remains dominant if:
1. Price gets rejected at the trendline
2. Bearish candles appear around 0.045 – 0.048
3. Price breaks below 0.04322
🎯 Bearish Downside Targets:
0.03800
0.03450
0.03000 (strong support & major demand zone)
➡️ A breakdown below 0.03000 could open the door for further bearish continuation.
---
🧠 Conclusion
Primary Trend: BEARISH
Price is currently at a critical decision zone
No confirmed trend reversal yet
Best approach: wait for breakout or breakdown confirmation
#GRT #GRTUSDT #CryptoAnalysis #TechnicalAnalysis #Altcoin #Downtrend #Trendline #BearishMarket #BullishBreakout #SupportResistance
On the Daily (1D) timeframe, GRT/USDT remains in a clear bearish market structure, characterized by:
Consistent Lower Highs and Lower Lows
Price trading below a descending trendline (yellow line)
Sellers still controlling the market despite a short-term rebound
The descending trendline acts as a major dynamic resistance, rejecting price multiple times in the past.
---
📐 Technical Pattern Explanation
🔻 Descending Trendline / Bearish Trend Structure
The yellow diagonal line represents a valid descending trendline formed from previous swing highs.
As long as price fails to break and close above this trendline, the overall bias remains bearish.
The current upward movement is still considered a pullback within a downtrend, not a confirmed trend reversal.
---
🟡 Key Support & Resistance Levels
Resistance Zones (Supply Areas):
0.04530 – 0.04800 → nearest resistance & rejection zone
0.05234
0.06050
0.06950
0.07950 – 0.08650
0.10120 – 0.10440 (major resistance / range high)
Support Zones (Demand Areas):
0.04322 (current minor support)
0.03800
0.03450
0.03000 → major low / strong demand zone
---
🚀 Bullish Scenario
The bullish scenario becomes valid only with confirmation:
1. Price breaks and closes above the descending trendline
2. Supported by increasing volume
3. Price holds above 0.04530 – 0.04800
🎯 Bullish Upside Targets:
0.05234
0.06050
0.06950
0.07950
0.08650
➡️ A confirmed breakout would signal a medium-term trend reversal from bearish to bullish.
---
🐻 Bearish Scenario
The bearish scenario remains dominant if:
1. Price gets rejected at the trendline
2. Bearish candles appear around 0.045 – 0.048
3. Price breaks below 0.04322
🎯 Bearish Downside Targets:
0.03800
0.03450
0.03000 (strong support & major demand zone)
➡️ A breakdown below 0.03000 could open the door for further bearish continuation.
---
🧠 Conclusion
Primary Trend: BEARISH
Price is currently at a critical decision zone
No confirmed trend reversal yet
Best approach: wait for breakout or breakdown confirmation
#GRT #GRTUSDT #CryptoAnalysis #TechnicalAnalysis #Altcoin #Downtrend #Trendline #BearishMarket #BullishBreakout #SupportResistance

✅ Get Free Signals! Join Our Telegram Channel Here: t.me/TheCryptoNuclear
✅ Twitter: twitter.com/crypto_nuclear
✅ Join Bybit : partner.bybit.com/b/nuclearvip
✅ Benefits : Lifetime Trading Fee Discount -50%
✅ Twitter: twitter.com/crypto_nuclear
✅ Join Bybit : partner.bybit.com/b/nuclearvip
✅ Benefits : Lifetime Trading Fee Discount -50%
Feragatname
Bilgiler ve yayınlar, TradingView tarafından sağlanan veya onaylanan finansal, yatırım, alım satım veya diğer türden tavsiye veya öneriler anlamına gelmez ve teşkil etmez. Kullanım Koşulları bölümünde daha fazlasını okuyun.
✅ Get Free Signals! Join Our Telegram Channel Here: t.me/TheCryptoNuclear
✅ Twitter: twitter.com/crypto_nuclear
✅ Join Bybit : partner.bybit.com/b/nuclearvip
✅ Benefits : Lifetime Trading Fee Discount -50%
✅ Twitter: twitter.com/crypto_nuclear
✅ Join Bybit : partner.bybit.com/b/nuclearvip
✅ Benefits : Lifetime Trading Fee Discount -50%
Feragatname
Bilgiler ve yayınlar, TradingView tarafından sağlanan veya onaylanan finansal, yatırım, alım satım veya diğer türden tavsiye veya öneriler anlamına gelmez ve teşkil etmez. Kullanım Koşulları bölümünde daha fazlasını okuyun.