
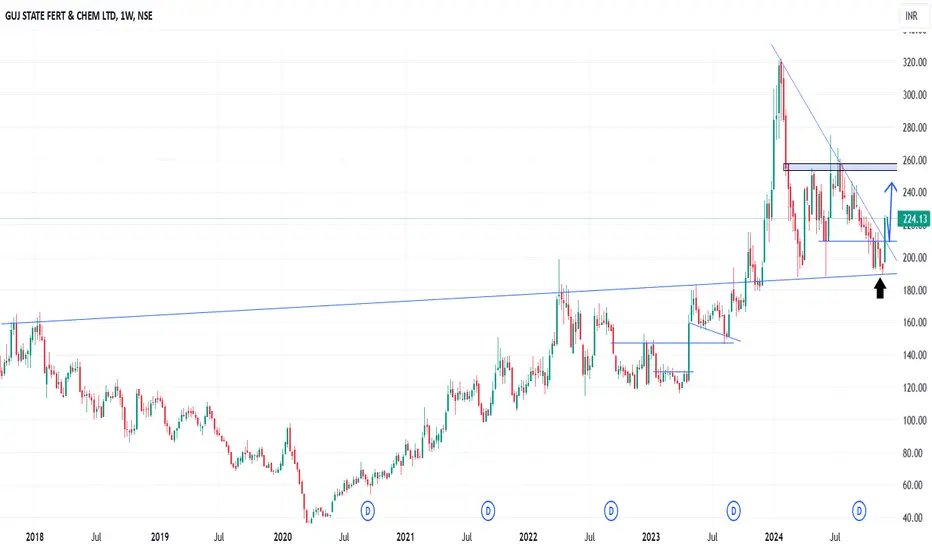
In the Weekly Chart of GSFC ,
we can see that, after Big Cup & handle breakout, it retested and formed a Hammer candle.
Also, it has shown an up move with W breakout.
et it retests it and then Enter with SL and Targets.
Expected momentum is shown in chart.
we can see that, after Big Cup & handle breakout, it retested and formed a Hammer candle.
Also, it has shown an up move with W breakout.
et it retests it and then Enter with SL and Targets.
Expected momentum is shown in chart.

Feragatname
Bilgiler ve yayınlar, TradingView tarafından sağlanan veya onaylanan finansal, yatırım, alım satım veya diğer türden tavsiye veya öneriler anlamına gelmez ve teşkil etmez. Kullanım Koşulları bölümünde daha fazlasını okuyun.
Feragatname
Bilgiler ve yayınlar, TradingView tarafından sağlanan veya onaylanan finansal, yatırım, alım satım veya diğer türden tavsiye veya öneriler anlamına gelmez ve teşkil etmez. Kullanım Koşulları bölümünde daha fazlasını okuyun.