Alış
HAPI Bottomed?
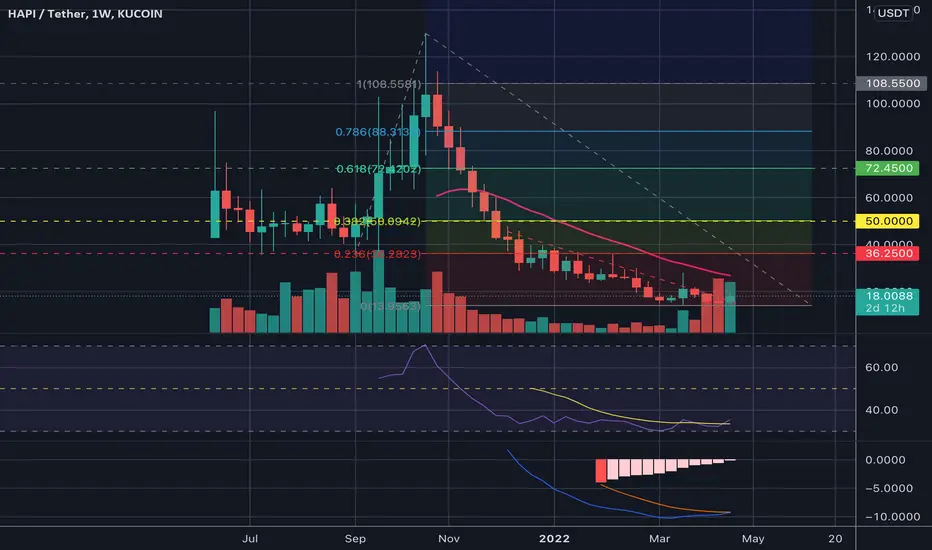
HAPI/USD (Weekly)
- Seem to have found Support at approx. the $15-16 area and range-bound for a while.
- MACD/Signal and Histogram reversing
- Volume increasing over the last 3 weeks
- RSI low reversing
- Looks to be closing above the 50MA on the daily
- Resistance levels marked out by the fib extension (String Resistance will be at $50 and approx $72 area. If we can break above with strength, we should be forming a new high.
- Strong Resistance at the $50 level shown by the Volume Profile
- Seem to have found Support at approx. the $15-16 area and range-bound for a while.
- MACD/Signal and Histogram reversing
- Volume increasing over the last 3 weeks
- RSI low reversing
- Looks to be closing above the 50MA on the daily
- Resistance levels marked out by the fib extension (String Resistance will be at $50 and approx $72 area. If we can break above with strength, we should be forming a new high.
- Strong Resistance at the $50 level shown by the Volume Profile

Feragatname
Bilgiler ve yayınlar, TradingView tarafından sağlanan veya onaylanan finansal, yatırım, alım satım veya diğer türden tavsiye veya öneriler anlamına gelmez ve teşkil etmez. Kullanım Koşulları bölümünde daha fazlasını okuyun.
Feragatname
Bilgiler ve yayınlar, TradingView tarafından sağlanan veya onaylanan finansal, yatırım, alım satım veya diğer türden tavsiye veya öneriler anlamına gelmez ve teşkil etmez. Kullanım Koşulları bölümünde daha fazlasını okuyun.