
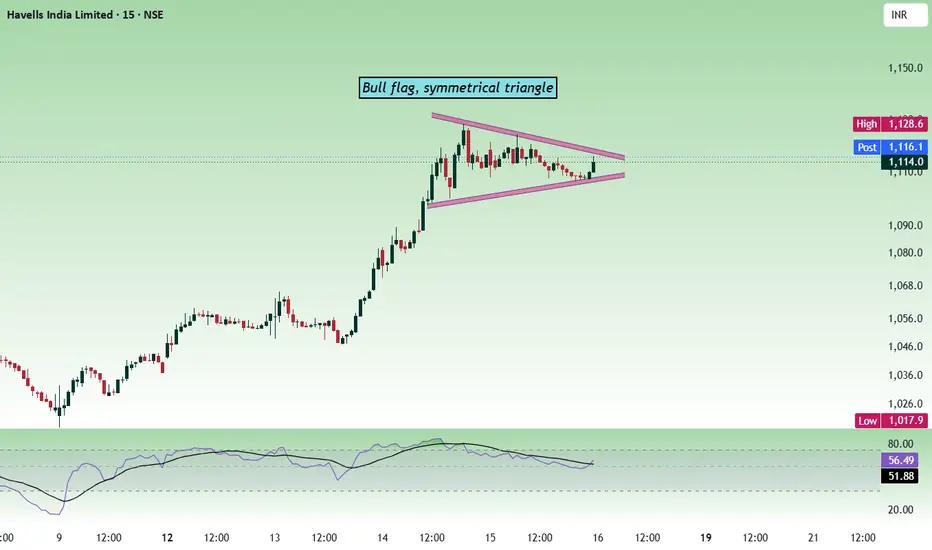
In the lower timeframe, the price is forming a symmetrical triangle. We can also see a bull flag formation. A symmetrical triangle is a neutral pattern, and the breakout can be in any direction. A bull flag is a bullish pattern.
On the daily timeframe, the price is forming a W pattern, which is bullish.

The price is bullish as long as it stays above 1082 - 1088.
Buy above 1110 - 1114 with a stop-loss of 1094 for the targets 1122, 1136, 1148, 1162 and 1176.
The price can face resistance at the 1130 zone, and sustaining above it is important to move up further.
Always do your analysis before taking any trade.
On the daily timeframe, the price is forming a W pattern, which is bullish.
The price is bullish as long as it stays above 1082 - 1088.
Buy above 1110 - 1114 with a stop-loss of 1094 for the targets 1122, 1136, 1148, 1162 and 1176.
The price can face resistance at the 1130 zone, and sustaining above it is important to move up further.
Always do your analysis before taking any trade.
İşlem aktif
T2 done. The price is having a pullback. 
Role I play here : Moderator. Follow me in telegram to trade better. t.me/Analysis4Newbie Contact information : tradingplan4u@gmail.com
Feragatname
Bilgiler ve yayınlar, TradingView tarafından sağlanan veya onaylanan finansal, yatırım, alım satım veya diğer türden tavsiye veya öneriler anlamına gelmez ve teşkil etmez. Kullanım Koşulları bölümünde daha fazlasını okuyun.
Role I play here : Moderator. Follow me in telegram to trade better. t.me/Analysis4Newbie Contact information : tradingplan4u@gmail.com
Feragatname
Bilgiler ve yayınlar, TradingView tarafından sağlanan veya onaylanan finansal, yatırım, alım satım veya diğer türden tavsiye veya öneriler anlamına gelmez ve teşkil etmez. Kullanım Koşulları bölümünde daha fazlasını okuyun.