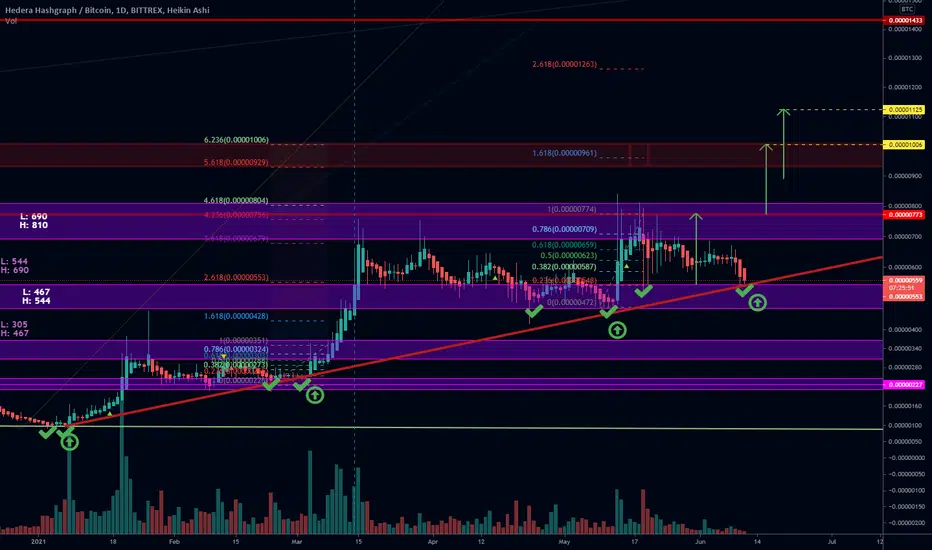
Our trend line has acted as a pivot for the last 3 moves, each time we found a bottom, twice, which ended near the trend line, and followed with a significant move up. Assuming this occurs again and we don't break below the trend line, we can expect a move to ~1000 sats, possibly as high as 1125.
Close below the trend line on the daily invalidates the trade. Possible outcomes of a break below the trend line are:
- repeating pattern idea:
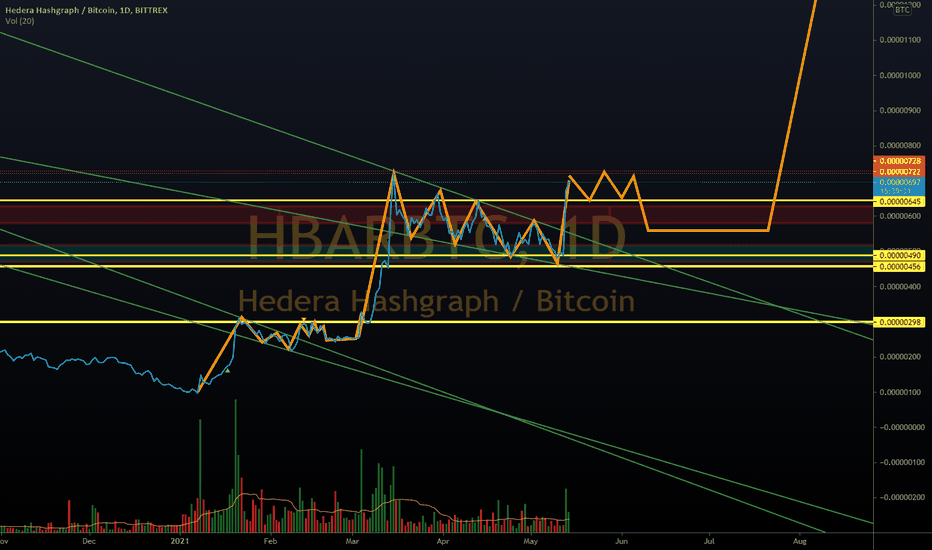
- triple bottom vs. btc (or a giant HSi may form)
Chart from this post is Heiken Ashi daily chart, levels were drawn using multiple time-frames, main trend line is drawn from daily candlestick. Targets are chosen via double bottom projection and fibs.
2 Hour Candlestick Chart zoomed in:

Daily Candlestick Chart, also zoomed in:

Close below the trend line on the daily invalidates the trade. Possible outcomes of a break below the trend line are:
- repeating pattern idea:
- triple bottom vs. btc (or a giant HSi may form)
Chart from this post is Heiken Ashi daily chart, levels were drawn using multiple time-frames, main trend line is drawn from daily candlestick. Targets are chosen via double bottom projection and fibs.
2 Hour Candlestick Chart zoomed in:
Daily Candlestick Chart, also zoomed in:
Not
Here's another interesting look, what if HBAR / BTC weekly is in a parallel channel (same scenarios still apply as described above):
Feragatname
Bilgiler ve yayınlar, TradingView tarafından sağlanan veya onaylanan finansal, yatırım, alım satım veya diğer türden tavsiye veya öneriler anlamına gelmez ve teşkil etmez. Kullanım Koşulları bölümünde daha fazlasını okuyun.
Feragatname
Bilgiler ve yayınlar, TradingView tarafından sağlanan veya onaylanan finansal, yatırım, alım satım veya diğer türden tavsiye veya öneriler anlamına gelmez ve teşkil etmez. Kullanım Koşulları bölümünde daha fazlasını okuyun.