
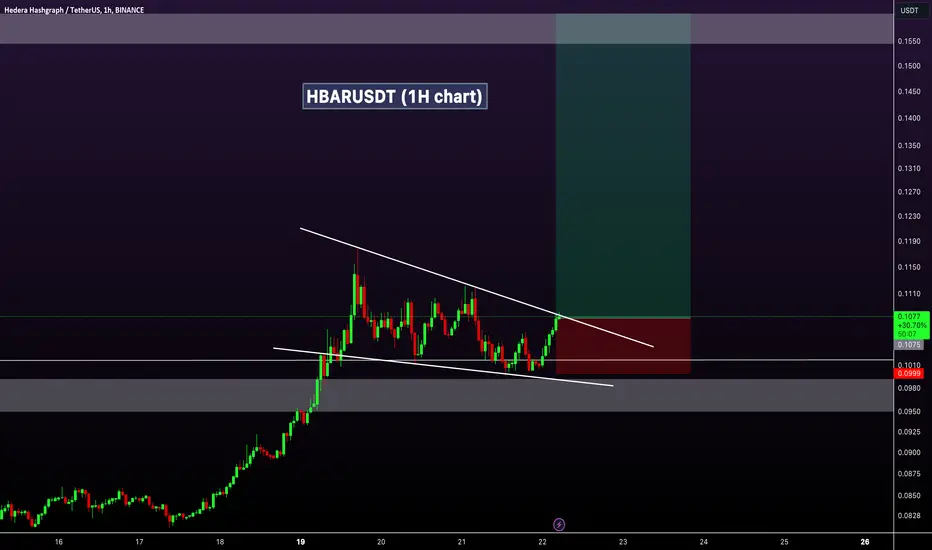
HBARUSDT Technical analysis update
HBAR formed a bullish flag pattern on the 1-hour chart. If the price exceeds the resistance line of the flag pattern, it could indicate potential upward movement in HBAR
Buy zone : Below $0.108
Stop loss : $0.100
Regards
Hexa
HBAR formed a bullish flag pattern on the 1-hour chart. If the price exceeds the resistance line of the flag pattern, it could indicate potential upward movement in HBAR
Buy zone : Below $0.108
Stop loss : $0.100
Regards
Hexa

🚀Telegram : t.me/hexatrades
🌐Website: hexatrades.io/
🗣️Twitter(X): twitter.com/HexaTrades
🌐Website: hexatrades.io/
🗣️Twitter(X): twitter.com/HexaTrades
İlgili yayınlar
Feragatname
Bilgiler ve yayınlar, TradingView tarafından sağlanan veya onaylanan finansal, yatırım, alım satım veya diğer türden tavsiye veya öneriler anlamına gelmez ve teşkil etmez. Kullanım Koşulları bölümünde daha fazlasını okuyun.
🚀Telegram : t.me/hexatrades
🌐Website: hexatrades.io/
🗣️Twitter(X): twitter.com/HexaTrades
🌐Website: hexatrades.io/
🗣️Twitter(X): twitter.com/HexaTrades
İlgili yayınlar
Feragatname
Bilgiler ve yayınlar, TradingView tarafından sağlanan veya onaylanan finansal, yatırım, alım satım veya diğer türden tavsiye veya öneriler anlamına gelmez ve teşkil etmez. Kullanım Koşulları bölümünde daha fazlasını okuyun.