
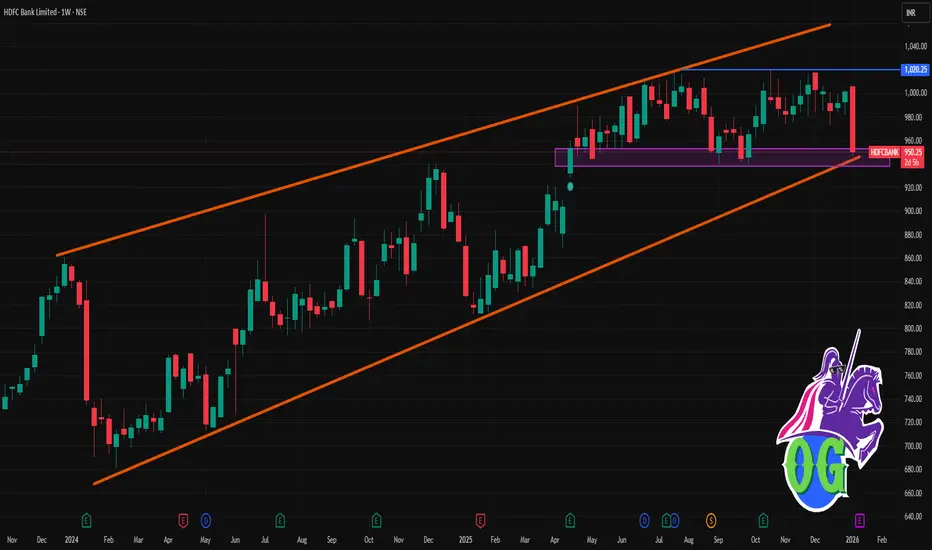
📌 Current Context (approx live price):
HDFC Bank shares are trading around ~₹950–₹970 on NSE recently.
📊 Key Weekly Levels (Short‑Term)
Resistance Levels (Upside)
R1: ~ ₹1,009 – ₹1,010 — first major resistance this week.
R2: ~ ₹1,016 – ₹1,017 — stronger supply zone if the stock pushes higher.
R3: ~ ₹1,025 – ₹1,030 — extended resistance early next week if buyers continue.
Support Levels (Downside)
S1: ~ ₹988 – ₹990 — immediate support zone this week.
S2: ~ ₹974 – ₹975 — second support if selling pressure increases.
S3: ~ ₹967 – ₹970 — lower band of the expected weekly trading range.
Projected Weekly Range:
👉 ~₹967 – ₹1,030 based on weekly pivot calculations and technical outlook.
🔍 How to Use These Levels This Week
Bullish scenario:
A sustained close above ~₹1,009–₹1,010 on daily closes could push price toward ₹1,016–₹1,030 in the next few sessions.
Bearish / stress scenario:
A break and close below ~₹974–₹970 could open space toward the ₹950–₹940 area (short‑term demand zones).

Contact Knowledgehub for a detailed consultation: Dm on WhatsApp: [wa.link/a2o0kz]-
Phone No: [+91 93102 26243]-
Email: [tradingviewknowledgehub@gmail.com]---
-- Let’s achieve success together!
Phone No: [+91 93102 26243]-
Email: [tradingviewknowledgehub@gmail.com]---
-- Let’s achieve success together!
İlgili yayınlar
Feragatname
Bilgiler ve yayınlar, TradingView tarafından sağlanan veya onaylanan finansal, yatırım, alım satım veya diğer türden tavsiye veya öneriler anlamına gelmez ve teşkil etmez. Kullanım Koşulları bölümünde daha fazlasını okuyun.