
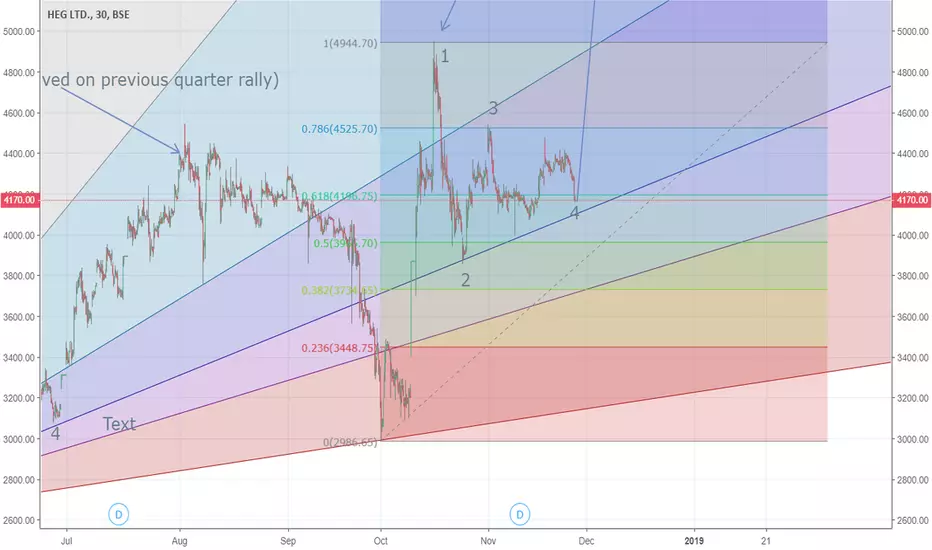
I have compared the Q1 and Q2 price movement patterns and have marked with numbers 1,2,3,4 (against each quarter). Also using the fibb retracement, I have charted that using the 4950 retracement rally levels from the bearish point of 2986 and expecting a target of 6154 and expect spikes of 6300-6400 (All time high expected) over the next 20 days.I am republishing this chart and your feedback is welcome.

Feragatname
Bilgiler ve yayınlar, TradingView tarafından sağlanan veya onaylanan finansal, yatırım, alım satım veya diğer türden tavsiye veya öneriler anlamına gelmez ve teşkil etmez. Kullanım Koşulları bölümünde daha fazlasını okuyun.
Feragatname
Bilgiler ve yayınlar, TradingView tarafından sağlanan veya onaylanan finansal, yatırım, alım satım veya diğer türden tavsiye veya öneriler anlamına gelmez ve teşkil etmez. Kullanım Koşulları bölümünde daha fazlasını okuyun.