
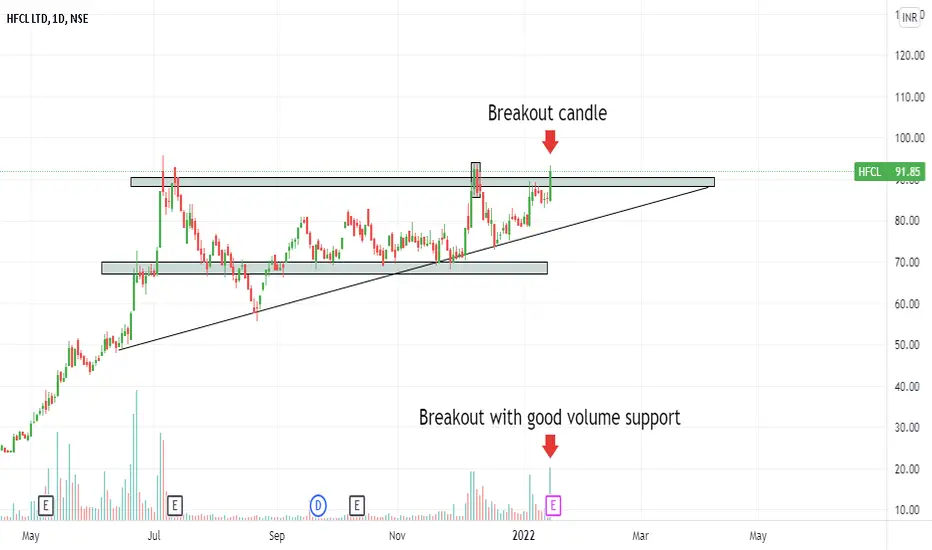
Here's the chart analysis of HFCL .
HFCL in an uptrend and it formed a Triangle Pattern breakout with a Good Volume support . In terms of the the pattern touches the Resistance zone and now gives a Breakout . after a breakout wait for a next move and price moves towards a upside .
HFCL in an uptrend and it formed a Triangle Pattern breakout with a Good Volume support . In terms of the the pattern touches the Resistance zone and now gives a Breakout . after a breakout wait for a next move and price moves towards a upside .

Feragatname
Bilgiler ve yayınlar, TradingView tarafından sağlanan veya onaylanan finansal, yatırım, alım satım veya diğer türden tavsiye veya öneriler anlamına gelmez ve teşkil etmez. Kullanım Koşulları bölümünde daha fazlasını okuyun.
Feragatname
Bilgiler ve yayınlar, TradingView tarafından sağlanan veya onaylanan finansal, yatırım, alım satım veya diğer türden tavsiye veya öneriler anlamına gelmez ve teşkil etmez. Kullanım Koşulları bölümünde daha fazlasını okuyun.