
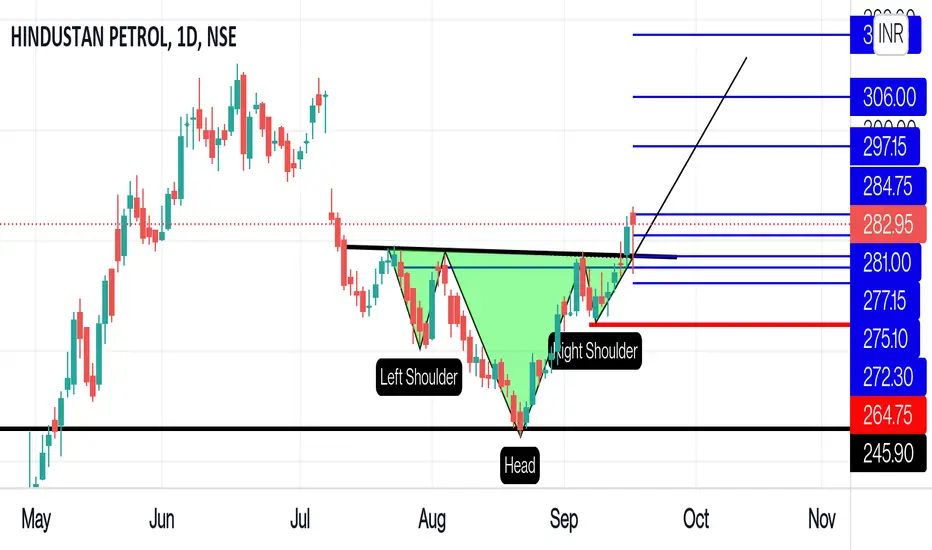
Hindustan petroleum, this stock has formed Inverted head and shoulder chart pattern on daily time frame, and recently it has given breakout from same along with the good intensity of volume, which indicates that the stock is supposed to be bullish, more interesting is bottom of head is at perfect horizontal support trendline and target of head and shoulder is also nearby previous highs or horizontal resistance levels. all indicators of weekly and daily are also aligned with each other, so this could be a good to go long at these levels or in dips (if any) with stoploss of recent swing low which is pegged at 264.75.
Inv head and shoulder chart pattern breakout with good intensity of volume in Daily

Retested neckline in hourly

Weekly macd is Uptick and also above zero line

Daily macd positive crossover and Uptick and also above zero line

Weekly Stochastic positive crossover and Uptick

Daily stochastic positive crossover and Uptick

Rsi in Weekly Uptick and also near 60

Rsi in daily above 60 uptick

Dmi adx also positive in daily

Disclaimer
I am not sebi registered analyst
My studies are Educational purpose only
Consult with your Financial advisor before trading or investing
Inv head and shoulder chart pattern breakout with good intensity of volume in Daily
Retested neckline in hourly
Weekly macd is Uptick and also above zero line
Daily macd positive crossover and Uptick and also above zero line
Weekly Stochastic positive crossover and Uptick
Daily stochastic positive crossover and Uptick
Rsi in Weekly Uptick and also near 60
Rsi in daily above 60 uptick
Dmi adx also positive in daily
Disclaimer
I am not sebi registered analyst
My studies are Educational purpose only
Consult with your Financial advisor before trading or investing

YouTube: youtube.com/@rk_charts
Telegram : t.me/RK_Charts
Twitter : @charts_rk
Email : rkcharts@gmail. com
Disclaimer.
I am not sebi registered analyst.
My studies are for educational purpose only.
Telegram : t.me/RK_Charts
Twitter : @charts_rk
Email : rkcharts@gmail. com
Disclaimer.
I am not sebi registered analyst.
My studies are for educational purpose only.
İlgili yayınlar
Feragatname
Bilgiler ve yayınlar, TradingView tarafından sağlanan veya onaylanan finansal, yatırım, alım satım veya diğer türden tavsiye veya öneriler anlamına gelmez ve teşkil etmez. Kullanım Koşulları bölümünde daha fazlasını okuyun.
YouTube: youtube.com/@rk_charts
Telegram : t.me/RK_Charts
Twitter : @charts_rk
Email : rkcharts@gmail. com
Disclaimer.
I am not sebi registered analyst.
My studies are for educational purpose only.
Telegram : t.me/RK_Charts
Twitter : @charts_rk
Email : rkcharts@gmail. com
Disclaimer.
I am not sebi registered analyst.
My studies are for educational purpose only.
İlgili yayınlar
Feragatname
Bilgiler ve yayınlar, TradingView tarafından sağlanan veya onaylanan finansal, yatırım, alım satım veya diğer türden tavsiye veya öneriler anlamına gelmez ve teşkil etmez. Kullanım Koşulları bölümünde daha fazlasını okuyun.