
29-11
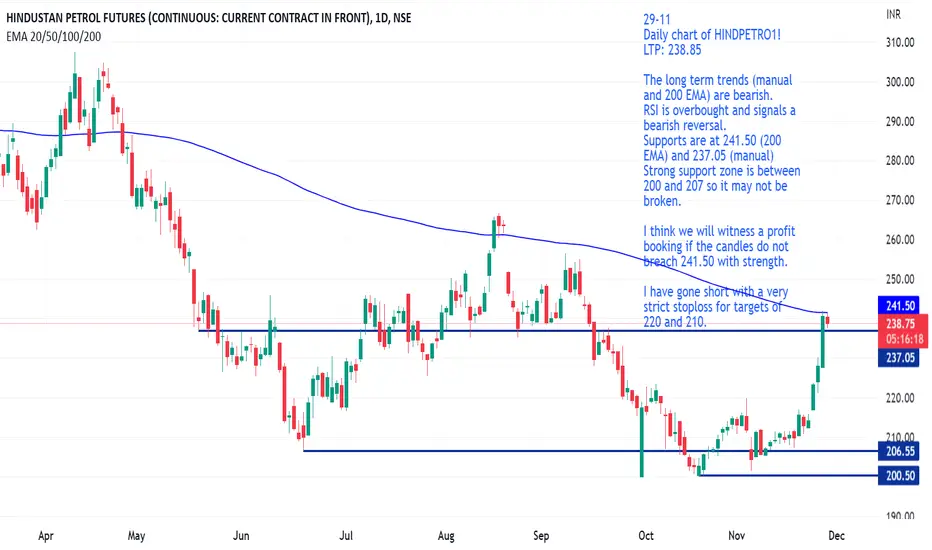
Daily chart of HINDPETRO1!
LTP: 238.85
The long term trends (manual and 200 EMA) are bearish.
RSI is overbought and signals a bearish reversal.
Supports are at 241.50 (200 EMA) and 237.05 (manual)
Strong support zone is between 200 and 207 so it may not be broken.
I think we will witness a profit booking if the candles do not breach 241.50 with strength.
I have gone short with a very strict stoploss for targets of 220 and 210.
Daily chart of HINDPETRO1!
LTP: 238.85
The long term trends (manual and 200 EMA) are bearish.
RSI is overbought and signals a bearish reversal.
Supports are at 241.50 (200 EMA) and 237.05 (manual)
Strong support zone is between 200 and 207 so it may not be broken.
I think we will witness a profit booking if the candles do not breach 241.50 with strength.
I have gone short with a very strict stoploss for targets of 220 and 210.

Feragatname
Bilgiler ve yayınlar, TradingView tarafından sağlanan veya onaylanan finansal, yatırım, alım satım veya diğer türden tavsiye veya öneriler anlamına gelmez ve teşkil etmez. Kullanım Koşulları bölümünde daha fazlasını okuyun.
Feragatname
Bilgiler ve yayınlar, TradingView tarafından sağlanan veya onaylanan finansal, yatırım, alım satım veya diğer türden tavsiye veya öneriler anlamına gelmez ve teşkil etmez. Kullanım Koşulları bölümünde daha fazlasını okuyun.