HTUSDT
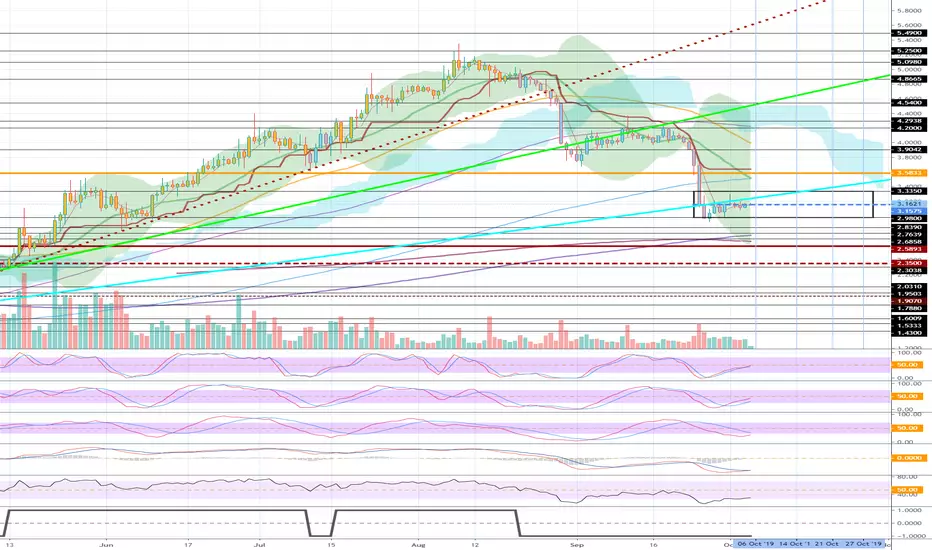
The sky blue uptrend line we drew on the previous chart is wrong.
HT is a bit off the light blue trend line, and I think it's a good position to keep the price.
The inflection date of the BTC chart is indicated.
We will see how the price of HT changes accordingly.
If you slowly climb along the upward trend line and reach 3.5833, you will see a full-fledged rise.
HT is a bit off the light blue trend line, and I think it's a good position to keep the price.
The inflection date of the BTC chart is indicated.
We will see how the price of HT changes accordingly.
If you slowly climb along the upward trend line and reach 3.5833, you will see a full-fledged rise.

[Practical trading strategy using HA-MS and SBOD]
youtu.be/aceN1AttX1Y
youtu.be/aceN1AttX1Y
Feragatname
Bilgiler ve yayınlar, TradingView tarafından sağlanan veya onaylanan finansal, yatırım, alım satım veya diğer türden tavsiye veya öneriler anlamına gelmez ve teşkil etmez. Kullanım Koşulları bölümünde daha fazlasını okuyun.