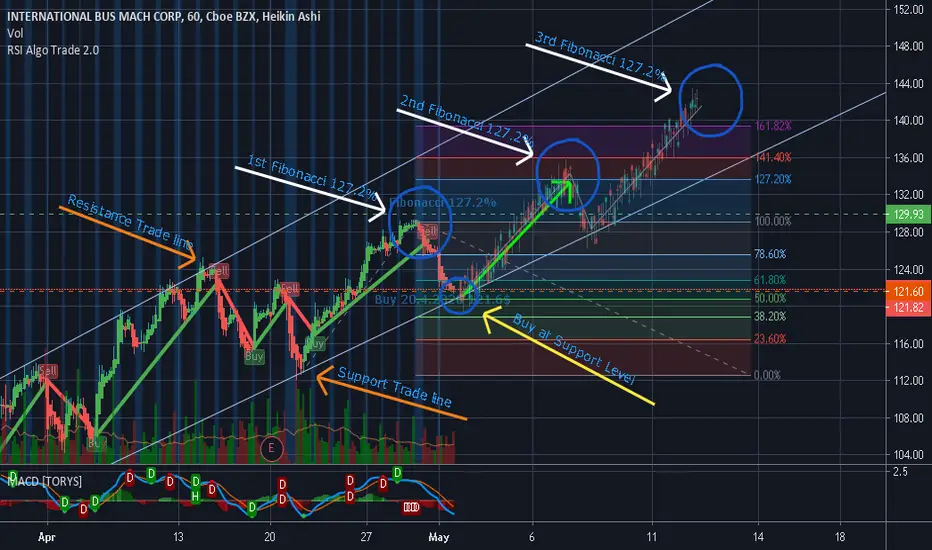
This trade analysis based on two levels, the support trade line and the resistance trade line (Orange color arrow).
When the stock IBM reach the 1st Fibonacci 127.2% it follow the Fibonacci retrace down to 61% - 50% and reach the Support trade line. At this moment, around 121$, its the time to take a profit at the 2nd Fibonacci 127% level. As well as for the 3rd ..... (144$)
When you look the MACD indicator it's will be the good time to buy the stock at low level
When the stock
IBM reach the 1st Fibonacci 127.2% it follow the Fibonacci retrace down to 61% - 50% and reach the Support trade line. At this moment, around 121$, its the time to take a profit at the 2nd Fibonacci 127% level. As well as for the 3rd ..... (144$)When you look the MACD indicator it's will be the good time to buy the stock at low level

Feragatname
Bilgiler ve yayınlar, TradingView tarafından sağlanan veya onaylanan finansal, yatırım, alım satım veya diğer türden tavsiye veya öneriler anlamına gelmez ve teşkil etmez. Kullanım Koşulları bölümünde daha fazlasını okuyun.
Feragatname
Bilgiler ve yayınlar, TradingView tarafından sağlanan veya onaylanan finansal, yatırım, alım satım veya diğer türden tavsiye veya öneriler anlamına gelmez ve teşkil etmez. Kullanım Koşulları bölümünde daha fazlasını okuyun.