
IBM watch $256-258: Key Resistance zone Break should RUN STRONG
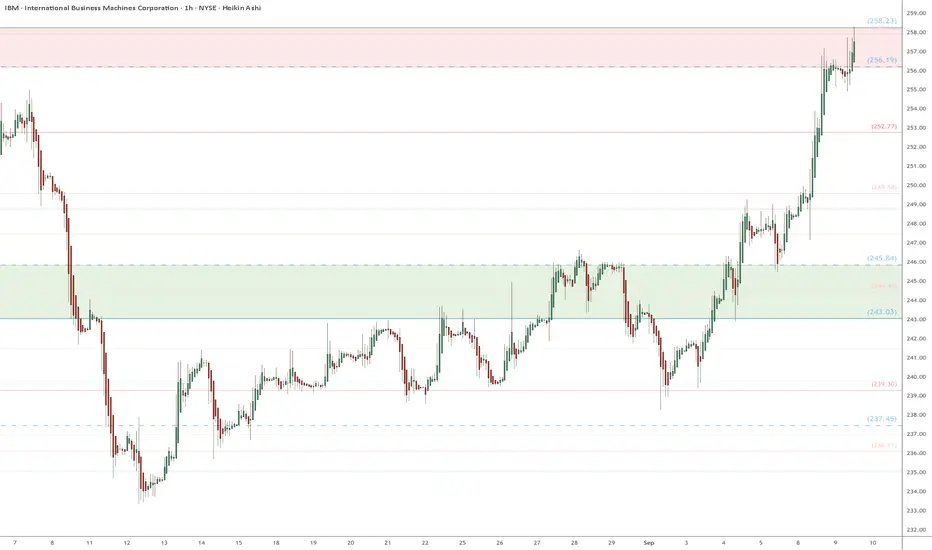
IBM has been clawing its way back from a downtrend.
Now testing a key Resistance zone at $256.19-258.21
Look for a Break-n-Retest or a Dip-to-Fib leg for entry.
.
See "Related Publications" for previous charts --------------->>>>>>>>>>>>>
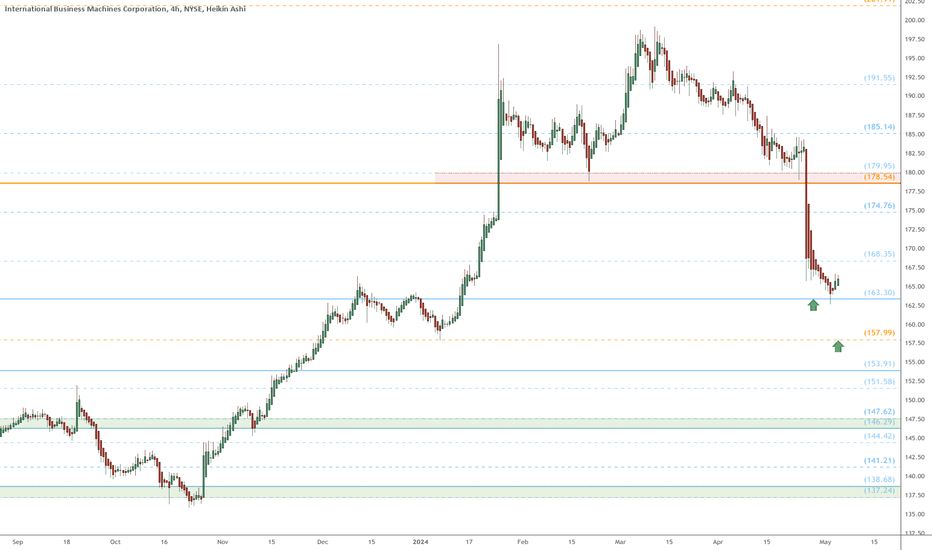
Such as this EXACT BOTTOM call:
Hit BOOST and FOLLOW for more such PRECISE and TIMELY charts.
=========================================================
.
Now testing a key Resistance zone at $256.19-258.21
Look for a Break-n-Retest or a Dip-to-Fib leg for entry.
.
See "Related Publications" for previous charts --------------->>>>>>>>>>>>>
Such as this EXACT BOTTOM call:
Hit BOOST and FOLLOW for more such PRECISE and TIMELY charts.
=========================================================
.

the Golden Ratio is my Religion
the Trading View is my Nation
the Moderator Tag is my Flag
the Trading View is my Nation
the Moderator Tag is my Flag
İlgili yayınlar
Feragatname
Bilgiler ve yayınlar, TradingView tarafından sağlanan veya onaylanan finansal, yatırım, alım satım veya diğer türden tavsiye veya öneriler anlamına gelmez ve teşkil etmez. Kullanım Koşulları bölümünde daha fazlasını okuyun.
the Golden Ratio is my Religion
the Trading View is my Nation
the Moderator Tag is my Flag
the Trading View is my Nation
the Moderator Tag is my Flag
İlgili yayınlar
Feragatname
Bilgiler ve yayınlar, TradingView tarafından sağlanan veya onaylanan finansal, yatırım, alım satım veya diğer türden tavsiye veya öneriler anlamına gelmez ve teşkil etmez. Kullanım Koşulları bölümünde daha fazlasını okuyun.