Alış
Icon (ICX) Weekly Chart | Falling Wedge | Targets
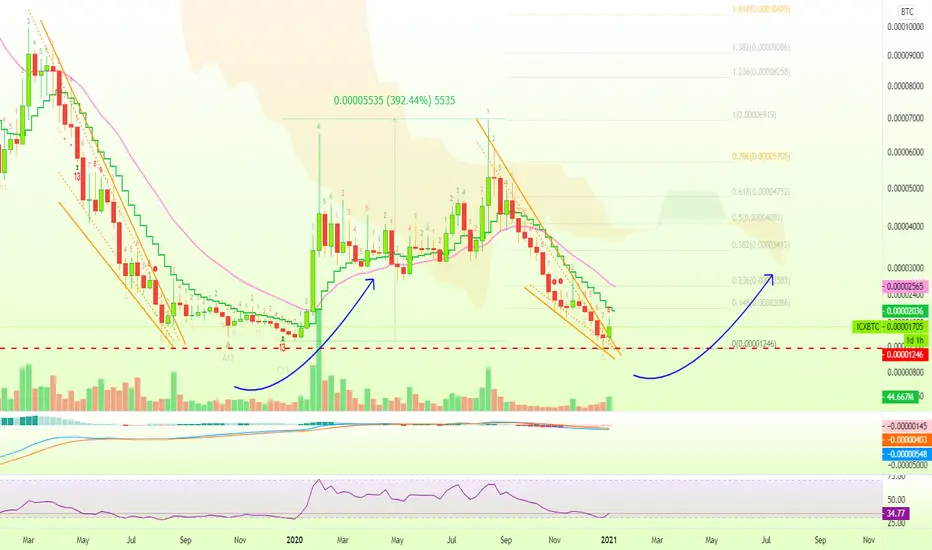
Let's compare the left side to the right side of the ICXBTC (Icon) chart... What do you see?
We have, to the left first, a falling wedge that was followed by a 390%+ bullish wave.
We have, to the right, a falling wedge that is likely to be followed by another bullish wave...
This is how the markets work.
They move in cycles/waves.
It goes up and down, up and down...
It is going DOWN...
It is time to go UP!
Namaste.
We have, to the left first, a falling wedge that was followed by a 390%+ bullish wave.
We have, to the right, a falling wedge that is likely to be followed by another bullish wave...
This is how the markets work.
They move in cycles/waves.
It goes up and down, up and down...
It is going DOWN...
It is time to go UP!
Namaste.

✅ Cryptocurrencies technical analysis & results
t.me/masteranandatrades/9279
✅ Stocks technical analysis
t.me/anandastocks
✅ Enjoyed the content? Join my PREMIUM channels for more... t.me/lamatrades/4 (since 2017)
t.me/masteranandatrades/9279
✅ Stocks technical analysis
t.me/anandastocks
✅ Enjoyed the content? Join my PREMIUM channels for more... t.me/lamatrades/4 (since 2017)
İlgili yayınlar
Feragatname
Bilgiler ve yayınlar, TradingView tarafından sağlanan veya onaylanan finansal, yatırım, alım satım veya diğer türden tavsiye veya öneriler anlamına gelmez ve teşkil etmez. Kullanım Koşulları bölümünde daha fazlasını okuyun.
✅ Cryptocurrencies technical analysis & results
t.me/masteranandatrades/9279
✅ Stocks technical analysis
t.me/anandastocks
✅ Enjoyed the content? Join my PREMIUM channels for more... t.me/lamatrades/4 (since 2017)
t.me/masteranandatrades/9279
✅ Stocks technical analysis
t.me/anandastocks
✅ Enjoyed the content? Join my PREMIUM channels for more... t.me/lamatrades/4 (since 2017)
İlgili yayınlar
Feragatname
Bilgiler ve yayınlar, TradingView tarafından sağlanan veya onaylanan finansal, yatırım, alım satım veya diğer türden tavsiye veya öneriler anlamına gelmez ve teşkil etmez. Kullanım Koşulları bölümünde daha fazlasını okuyun.