
Key Support Levels
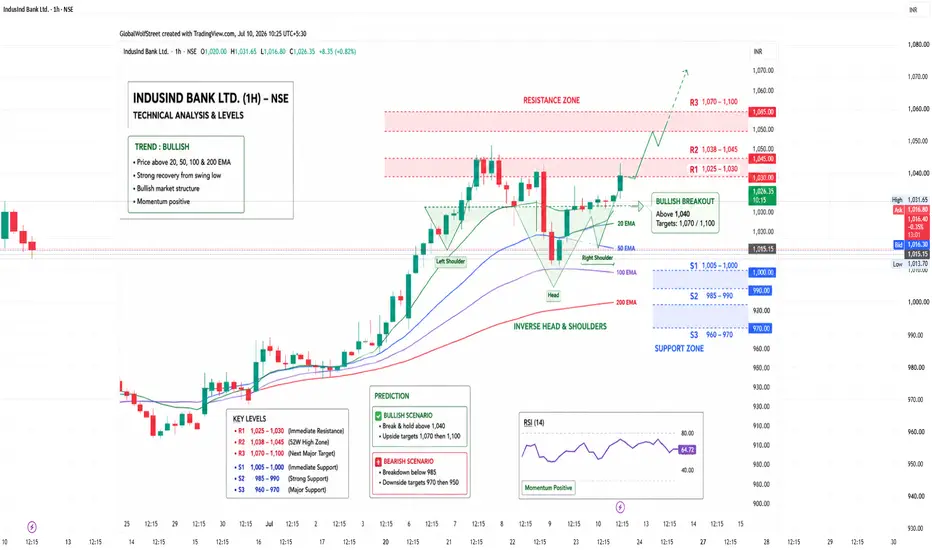
₹1,005–1,000 – Immediate support
₹985–990 – Strong swing support
₹960–970 – Major positional support
Key Resistance Levels
₹1,025–1,030 – Immediate resistance
₹1,038–1,045 – 52-week high zone
₹1,070–1,100 – Next positional target if breakout sustains
Technical View
✅ Price is above the 20, 50, 100 and 200-day moving averages, indicating a bullish medium-term trend.
✅ RSI is in the bullish zone (around 65–72), showing strong momentum, though the stock may become overbought if it rallies sharply.
✅ The stock has confirmed an inverse head-and-shoulders breakout, a pattern often associated with trend reversals and continued upside.
Trading Strategy
Bullish scenario
Buy on dips near ₹995–1,005
Breakout above ₹1,040 could lead to ₹1,070 and then ₹1,100
Bearish scenario
A close below ₹985 may trigger profit booking toward ₹960–970
Overall Outlook
Short-term: Bullish
Medium-term: Bullish
Long-term: Positive as long as the stock remains above ₹960–970
If you're looking for an intraday, BTST, or next-week analysis with exact entry, stop-loss, and target levels, let me know your trading style and I can tailor the levels accordingly.
₹1,005–1,000 – Immediate support
₹985–990 – Strong swing support
₹960–970 – Major positional support
Key Resistance Levels
₹1,025–1,030 – Immediate resistance
₹1,038–1,045 – 52-week high zone
₹1,070–1,100 – Next positional target if breakout sustains
Technical View
✅ Price is above the 20, 50, 100 and 200-day moving averages, indicating a bullish medium-term trend.
✅ RSI is in the bullish zone (around 65–72), showing strong momentum, though the stock may become overbought if it rallies sharply.
✅ The stock has confirmed an inverse head-and-shoulders breakout, a pattern often associated with trend reversals and continued upside.
Trading Strategy
Bullish scenario
Buy on dips near ₹995–1,005
Breakout above ₹1,040 could lead to ₹1,070 and then ₹1,100
Bearish scenario
A close below ₹985 may trigger profit booking toward ₹960–970
Overall Outlook
Short-term: Bullish
Medium-term: Bullish
Long-term: Positive as long as the stock remains above ₹960–970
If you're looking for an intraday, BTST, or next-week analysis with exact entry, stop-loss, and target levels, let me know your trading style and I can tailor the levels accordingly.

İlgili yayınlar
Feragatname
Bilgiler ve yayınlar, TradingView tarafından sağlanan veya onaylanan finansal, yatırım, alım satım veya diğer türden tavsiye veya öneriler anlamına gelmez ve teşkil etmez. Kullanım Koşulları bölümünde daha fazlasını okuyun.
İlgili yayınlar
Feragatname
Bilgiler ve yayınlar, TradingView tarafından sağlanan veya onaylanan finansal, yatırım, alım satım veya diğer türden tavsiye veya öneriler anlamına gelmez ve teşkil etmez. Kullanım Koşulları bölümünde daha fazlasını okuyun.