
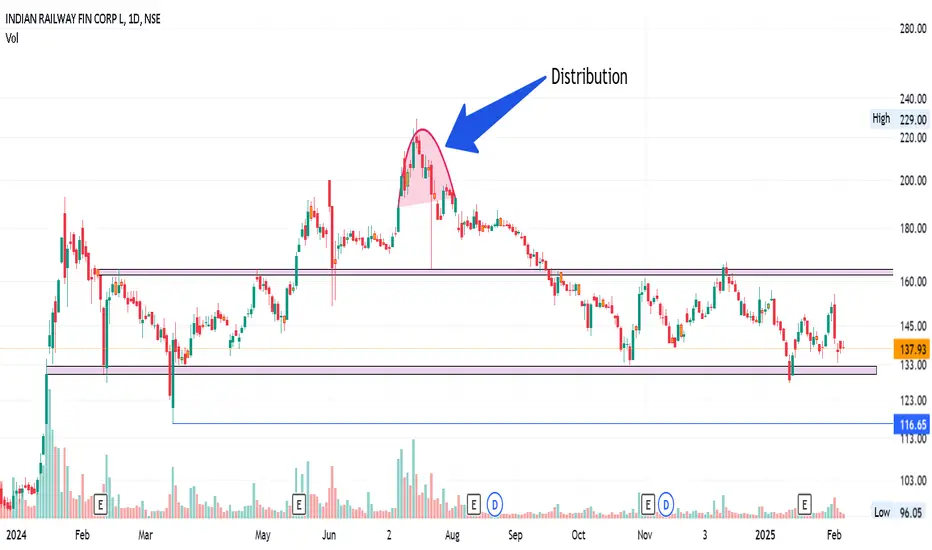
After a good rally, the stock is trading near major support. If it breaks down with a close of the weekly candle below support, then the first target will be 116, and the second will be 90 easily.
It looks strong and will turn bullish on a weekly close above 170.
For a successful breakout/breakdown, we should ideally see a strong respective timeframe candle on our chart to close —it’s crucial to use that timeframe.
Following the breakout/breakdown, the ideal entry point would be after a consecutive candle that breaks above/below the breakout/breakdown candle
As always, remember to do your own research before making any investment decisions!
It looks strong and will turn bullish on a weekly close above 170.
For a successful breakout/breakdown, we should ideally see a strong respective timeframe candle on our chart to close —it’s crucial to use that timeframe.
Following the breakout/breakdown, the ideal entry point would be after a consecutive candle that breaks above/below the breakout/breakdown candle
As always, remember to do your own research before making any investment decisions!

Feragatname
Bilgiler ve yayınlar, TradingView tarafından sağlanan veya onaylanan finansal, yatırım, alım satım veya diğer türden tavsiye veya öneriler anlamına gelmez ve teşkil etmez. Kullanım Koşulları bölümünde daha fazlasını okuyun.
Feragatname
Bilgiler ve yayınlar, TradingView tarafından sağlanan veya onaylanan finansal, yatırım, alım satım veya diğer türden tavsiye veya öneriler anlamına gelmez ve teşkil etmez. Kullanım Koşulları bölümünde daha fazlasını okuyun.