
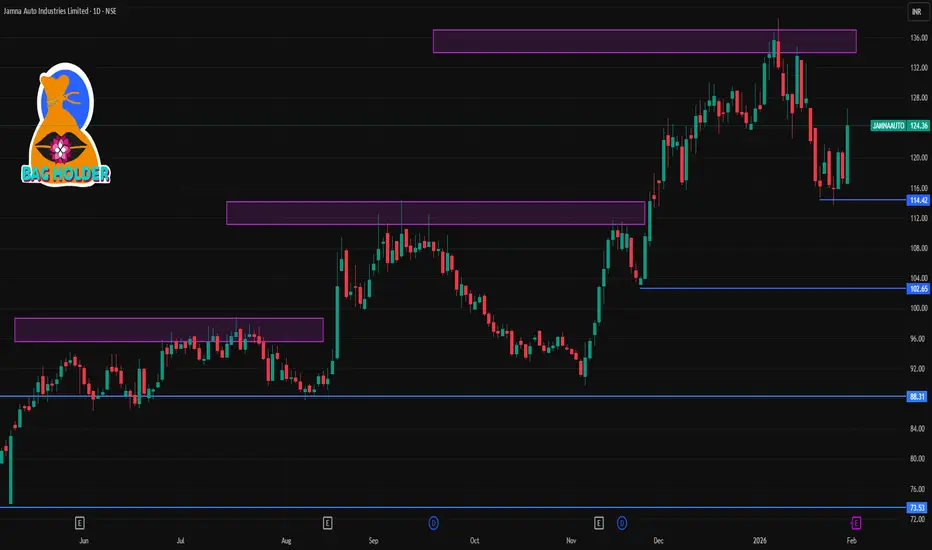
• Last close: ~₹124 – ₹124.36 on NSE/BSE.
• Recent daily range: Low ~₹116.60 – High ~₹126.55.
📊 Daily Support & Resistance Levels (Key Zones)
Pivot Point (Daily)
Daily Pivot ~ ₹120 – ₹123.55: Key reference for intraday bias — above is bullish, below is bearish.
Resistance Levels
R1: ~ ₹125–₹125.32 – first hurdle above pivot.
R2: ~ ₹128–₹128.38 – stronger resistance near recent swing highs.
R3: ~ ₹130–₹130.15 – extended upside pivot.
Support Levels
S1: ~ ₹120 – ₹120.49 – first support near pivot/MA levels.
S2: ~ ₹118.5 – ₹118.72 – next layer of downside support.
S3: ~ ₹115.5 – ₹115.66 – deeper support zone.
These pivot-derived levels are commonly used for intraday and next-day trading reference.
📈 What Technical Indicators Suggest (Daily)
Moving Averages / Momentum
Short-term MAs around 20–50 DMA are near the pivot zone, indicating mixed momentum around the current price.
On some technical panels, oscillators like RSI may be neutral or slightly bearish/bullish depending on the source — indicating no strong momentum bias right now.
🧠 How to Use This for a 1-Day View
Bullish Bias (short-term) if:
✔ Price sustains above daily pivot (~₹122–123)
✔ Break of R2 (~₹128–₹128.4) with volume
Bearish / Caution if:
❌ Price closes below S1 (~₹120)
❌ Momentum indicators turn down from resistance
⚠️ Risk & Notes
These levels are technical guides — not investment advice.
Price can gap on news earnings, market sentiment, or sector moves.
Always combine with your own risk management (stop-loss, position sizing).
• Recent daily range: Low ~₹116.60 – High ~₹126.55.
📊 Daily Support & Resistance Levels (Key Zones)
Pivot Point (Daily)
Daily Pivot ~ ₹120 – ₹123.55: Key reference for intraday bias — above is bullish, below is bearish.
Resistance Levels
R1: ~ ₹125–₹125.32 – first hurdle above pivot.
R2: ~ ₹128–₹128.38 – stronger resistance near recent swing highs.
R3: ~ ₹130–₹130.15 – extended upside pivot.
Support Levels
S1: ~ ₹120 – ₹120.49 – first support near pivot/MA levels.
S2: ~ ₹118.5 – ₹118.72 – next layer of downside support.
S3: ~ ₹115.5 – ₹115.66 – deeper support zone.
These pivot-derived levels are commonly used for intraday and next-day trading reference.
📈 What Technical Indicators Suggest (Daily)
Moving Averages / Momentum
Short-term MAs around 20–50 DMA are near the pivot zone, indicating mixed momentum around the current price.
On some technical panels, oscillators like RSI may be neutral or slightly bearish/bullish depending on the source — indicating no strong momentum bias right now.
🧠 How to Use This for a 1-Day View
Bullish Bias (short-term) if:
✔ Price sustains above daily pivot (~₹122–123)
✔ Break of R2 (~₹128–₹128.4) with volume
Bearish / Caution if:
❌ Price closes below S1 (~₹120)
❌ Momentum indicators turn down from resistance
⚠️ Risk & Notes
These levels are technical guides — not investment advice.
Price can gap on news earnings, market sentiment, or sector moves.
Always combine with your own risk management (stop-loss, position sizing).

Contact Knowledgehub for a detailed consultation: Dm on WhatsApp: [wa.link/a2o0kz]-
Phone No: [+91 93102 26243]-
Email: [tradingviewknowledgehub@gmail.com]---
-- Let’s achieve success together!
Phone No: [+91 93102 26243]-
Email: [tradingviewknowledgehub@gmail.com]---
-- Let’s achieve success together!
İlgili yayınlar
Feragatname
Bilgiler ve yayınlar, TradingView tarafından sağlanan veya onaylanan finansal, yatırım, alım satım veya diğer türden tavsiye veya öneriler anlamına gelmez ve teşkil etmez. Kullanım Koşulları bölümünde daha fazlasını okuyun.
Contact Knowledgehub for a detailed consultation: Dm on WhatsApp: [wa.link/a2o0kz]-
Phone No: [+91 93102 26243]-
Email: [tradingviewknowledgehub@gmail.com]---
-- Let’s achieve success together!
Phone No: [+91 93102 26243]-
Email: [tradingviewknowledgehub@gmail.com]---
-- Let’s achieve success together!
İlgili yayınlar
Feragatname
Bilgiler ve yayınlar, TradingView tarafından sağlanan veya onaylanan finansal, yatırım, alım satım veya diğer türden tavsiye veya öneriler anlamına gelmez ve teşkil etmez. Kullanım Koşulları bölümünde daha fazlasını okuyun.