GOLD INVERSE EFTs -Time to go long GOLD 3X ( JNUG / JDST )
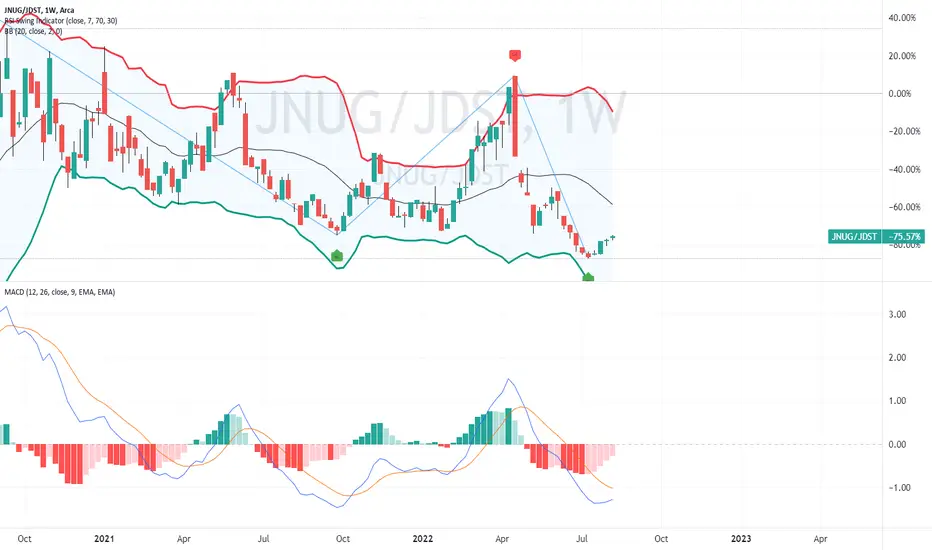
 JNUG
JNUGThis chart analysis would serve as a guide to a swing trader or investor
seeking or continuing trades in the 3x gold EFTs JNUG and JDST.
Bu setting up the ratio between the two over time, pivot points
can serve as a reference to buy one and sell the other or initial
position.
The chart shows the JNUG price for May 2022, April 2021 and August 2020
while presently the JNUG completed a pivot low with a signal
from the RSI swing indicator. Since three weeks ago, the price
is rising albeit with weekly green Doji candles.
The MACD, a lagging indicator, shows an impending K/D
crossover under the histogram.
All in all, ow may be the time to take a trade-in JNUG, which
has risen by 20% in an ascending channel over the past three
weeks.
Not
the JNUG trade is progressing well now that it has completed the cup and handleand is in bullish continuation. XAUUSD is playing on forex.

Feragatname
Bilgiler ve yayınlar, TradingView tarafından sağlanan veya onaylanan finansal, yatırım, alım satım veya diğer türden tavsiye veya öneriler anlamına gelmez ve teşkil etmez. Kullanım Koşulları bölümünde daha fazlasını okuyun.
Feragatname
Bilgiler ve yayınlar, TradingView tarafından sağlanan veya onaylanan finansal, yatırım, alım satım veya diğer türden tavsiye veya öneriler anlamına gelmez ve teşkil etmez. Kullanım Koşulları bölümünde daha fazlasını okuyun.