Alış
Trending Kellog
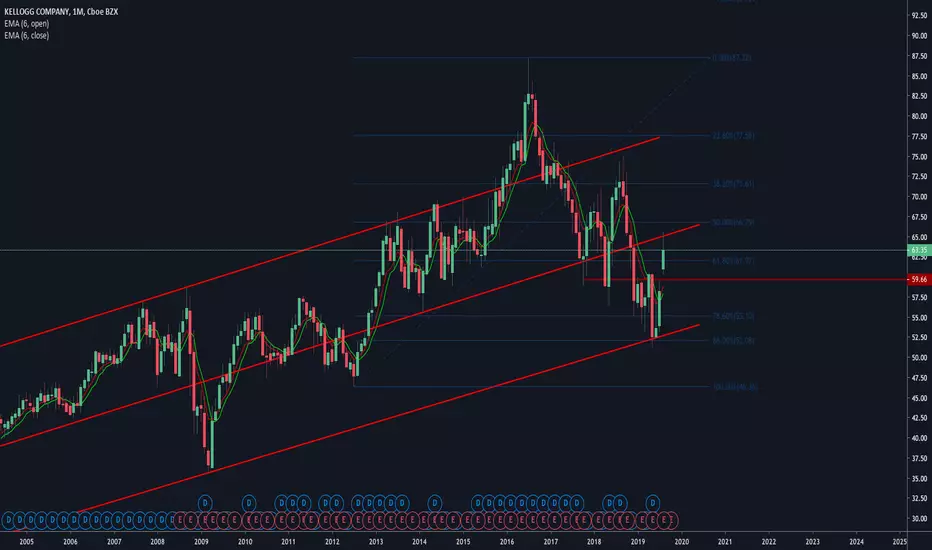
Chart Analysis
It's a bit late, but we see on weekly and monthly chart that $NYSE:K made a nice turn on long term trendline.
Last week the chart formed a nice low around the Fibonacci 78.6.
Of course, we missed the low, but maybe we get a second chance around 60$ to enter.
Dividend
3.6% dividend
Payout ratio 58%
14 years Dividend Growth
It's a bit late, but we see on weekly and monthly chart that $NYSE:K made a nice turn on long term trendline.
Last week the chart formed a nice low around the Fibonacci 78.6.
Of course, we missed the low, but maybe we get a second chance around 60$ to enter.
Dividend
3.6% dividend
Payout ratio 58%
14 years Dividend Growth

Feragatname
Bilgiler ve yayınlar, TradingView tarafından sağlanan veya onaylanan finansal, yatırım, alım satım veya diğer türden tavsiye veya öneriler anlamına gelmez ve teşkil etmez. Kullanım Koşulları bölümünde daha fazlasını okuyun.
Feragatname
Bilgiler ve yayınlar, TradingView tarafından sağlanan veya onaylanan finansal, yatırım, alım satım veya diğer türden tavsiye veya öneriler anlamına gelmez ve teşkil etmez. Kullanım Koşulları bölümünde daha fazlasını okuyun.