
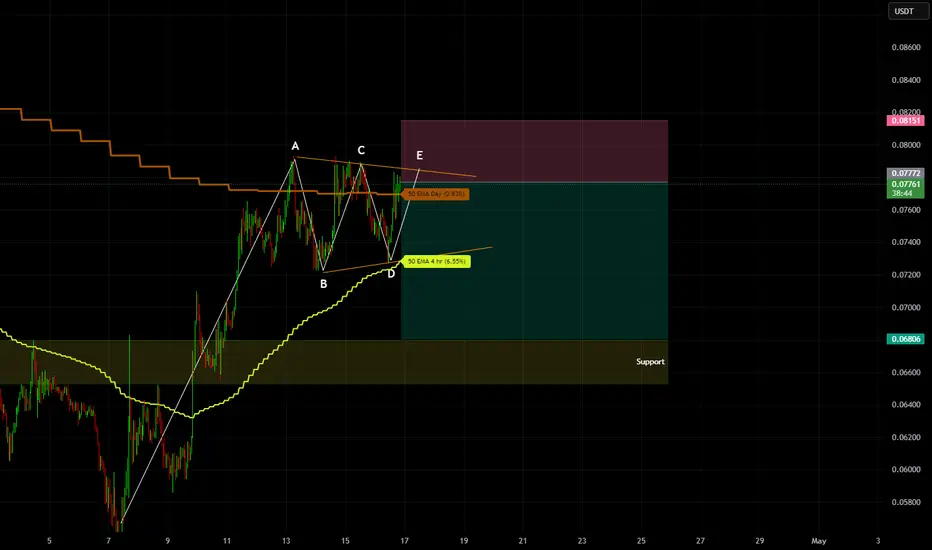
Looks like KASUSDT is wrapping up an ABCDE reversal pattern right on the daily 50EMA — point E seems to be the final touch.
What stands out is how that 50EMA is acting like a brick wall — price got rejected at A, C, and now again at E.
My target’s the support zone marked on the chart.
I’m not setting a tight stop — too easy to get wicked out by some stop-hunting move.
I’ll only cut the trade if we get multiple candle bodies closing clean above the daily 50EMA.
İşlem elle kapatılmış
Closing the trade at current price with profit.
Feragatname
Bilgiler ve yayınlar, TradingView tarafından sağlanan veya onaylanan finansal, yatırım, alım satım veya diğer türden tavsiye veya öneriler anlamına gelmez ve teşkil etmez. Kullanım Koşulları bölümünde daha fazlasını okuyun.
Feragatname
Bilgiler ve yayınlar, TradingView tarafından sağlanan veya onaylanan finansal, yatırım, alım satım veya diğer türden tavsiye veya öneriler anlamına gelmez ve teşkil etmez. Kullanım Koşulları bölümünde daha fazlasını okuyun.