Alış
KNCUSD - Weekly analysis
ANALYSIS 🔎
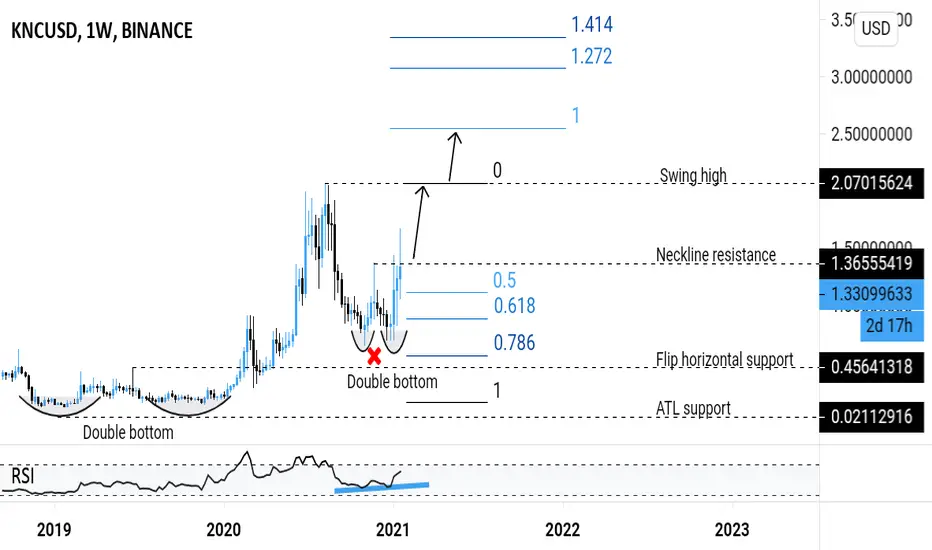
- KNCUSD retested the flip horizontal support and 0.618 fibonacci retracement level.
- Price action printed the double bottom trend reversal pattern.
- Price brokeout above the double bottom neckline resistance.
- This is a bullish signal.
- RSI printed a bullish divergence signal.
TARGETS 🎯
- Swing high
- Fibonacci extension levels
- KNCUSD retested the flip horizontal support and 0.618 fibonacci retracement level.
- Price action printed the double bottom trend reversal pattern.
- Price brokeout above the double bottom neckline resistance.
- This is a bullish signal.
- RSI printed a bullish divergence signal.
TARGETS 🎯
- Swing high
- Fibonacci extension levels

Feragatname
Bilgiler ve yayınlar, TradingView tarafından sağlanan veya onaylanan finansal, yatırım, alım satım veya diğer türden tavsiye veya öneriler anlamına gelmez ve teşkil etmez. Kullanım Koşulları bölümünde daha fazlasını okuyun.
Feragatname
Bilgiler ve yayınlar, TradingView tarafından sağlanan veya onaylanan finansal, yatırım, alım satım veya diğer türden tavsiye veya öneriler anlamına gelmez ve teşkil etmez. Kullanım Koşulları bölümünde daha fazlasını okuyun.