
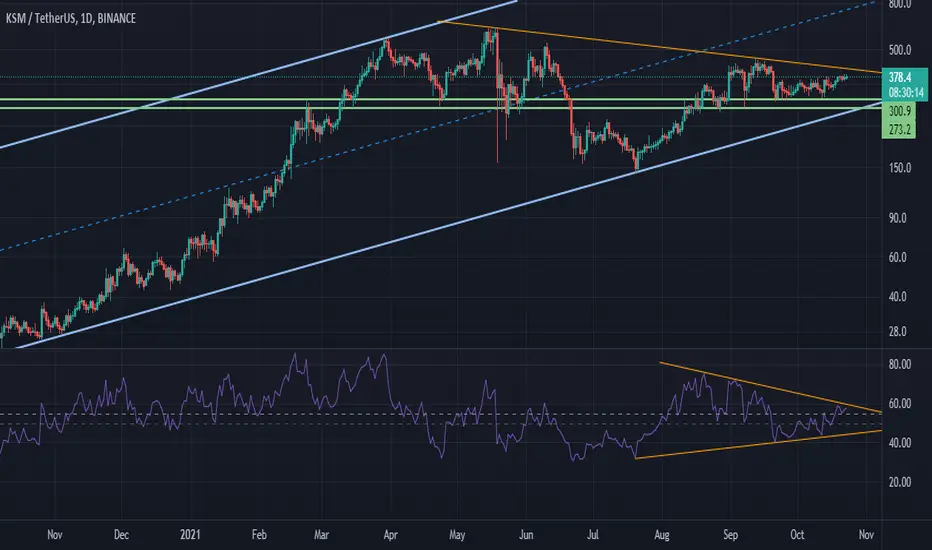
It has a chart similar to the Bitcoin chart when it was priced at $ 40,000
There is a lot of room for growth if you cross the trend line
Shopping in steps is the best way
For the next two months, any negative amount on this chart is just a good buy position
There is a lot of room for growth if you cross the trend line
Shopping in steps is the best way
For the next two months, any negative amount on this chart is just a good buy position

Feragatname
Bilgiler ve yayınlar, TradingView tarafından sağlanan veya onaylanan finansal, yatırım, alım satım veya diğer türden tavsiye veya öneriler anlamına gelmez ve teşkil etmez. Kullanım Koşulları bölümünde daha fazlasını okuyun.
Feragatname
Bilgiler ve yayınlar, TradingView tarafından sağlanan veya onaylanan finansal, yatırım, alım satım veya diğer türden tavsiye veya öneriler anlamına gelmez ve teşkil etmez. Kullanım Koşulları bölümünde daha fazlasını okuyun.