
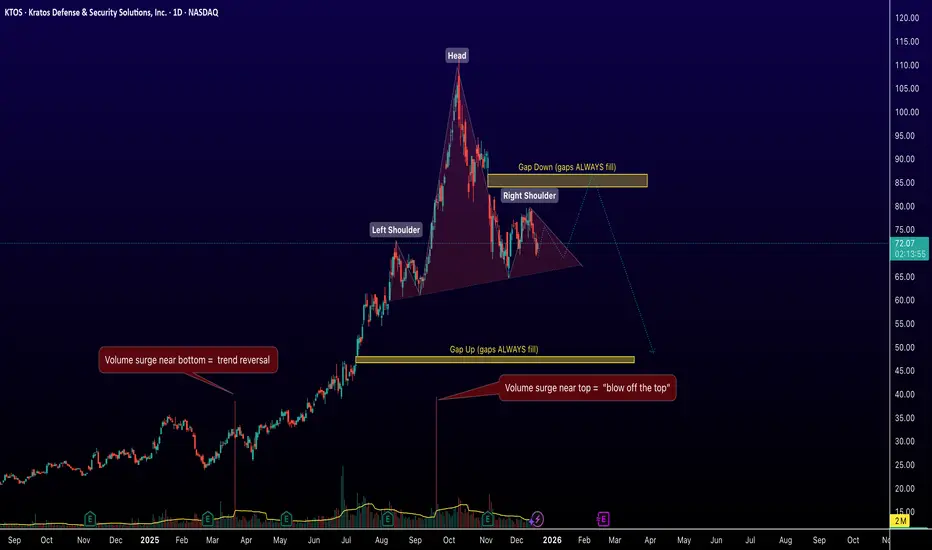
KTOS – Technical Breakdown: Head & Shoulders Distribution in Progress
1 — Macro Context: Trend Maturity
KTOS spent the majority of the year in a sustained impulsive uptrend, defined by higher highs, higher lows, and expanding participation. As trends mature, price action typically becomes more volatile and emotional, creating the conditions necessary for structural reversal.
Early contextual signals:
2 — Head & Shoulders Distribution
The dominant structure on the chart is a well-defined Head & Shoulders formation:
This structure reflects distribution rather than immediate bearishness — buyers are progressively less willing or able to push price higher.
3 — Neckline Interaction and Compression
Price is currently compressing into a descending wedge / triangle near the neckline region.
Why this matters:
4 — Gaps as Liquidity Zones
Two major price inefficiencies stand out on the chart:
While “gaps always fill” is not a rule, unfilled gaps frequently behave as high-probability areas of interest due to liquidity seeking behavior.
5 — Volume as Confirmation
Volume validates the structural narrative:
Price patterns without volume context should be treated as incomplete.
6 — Educational Projection (Not a Forecast)
This projection is intended to demonstrate market tendencies rather than guarantee outcomes.
Final Thoughts
KTOS highlights several repeatable market principles:
Trade safe. Stay objective. Let structure and volume do the talking.
This chart of Kratos Defense & Security Solutions (KTOS) illustrates a high-quality example of how market structure, volume behavior, and price inefficiencies combine during a transition from trend continuation to distribution. The purpose of this breakdown is educational, not predictive.
1 — Macro Context: Trend Maturity
KTOS spent the majority of the year in a sustained impulsive uptrend, defined by higher highs, higher lows, and expanding participation. As trends mature, price action typically becomes more volatile and emotional, creating the conditions necessary for structural reversal.
Early contextual signals:
- Rising volume near the prior base marked accumulation and confirmed a trend reversal higher.
- Accelerating volume near the highs later in the year signaled emotional participation and distribution.
2 — Head & Shoulders Distribution
The dominant structure on the chart is a well-defined Head & Shoulders formation:
- Left Shoulder: Higher high followed by a controlled pullback on moderate volume.
- Head: Vertical expansion into new highs, accompanied by peak volume and momentum exhaustion.
- Right Shoulder: Lower high with weaker follow-through and declining demand.
This structure reflects distribution rather than immediate bearishness — buyers are progressively less willing or able to push price higher.
Key takeaway:
Head & Shoulders patterns are not bearish because of the shape — they are bearish because demand fails.
3 — Neckline Interaction and Compression
Price is currently compressing into a descending wedge / triangle near the neckline region.
Why this matters:
- Compression following distribution often resolves in the direction of the larger reversal.
- Volatility contraction frequently precedes expansion.
- A decisive breakdown from this structure confirms seller control.
4 — Gaps as Liquidity Zones
Two major price inefficiencies stand out on the chart:
- Gap Down (upper zone): Functions as overhead resistance and a supply magnet on any retrace.
- Gap Up (lower zone): Represents an unfilled imbalance below, acting as a potential liquidity target.
While “gaps always fill” is not a rule, unfilled gaps frequently behave as high-probability areas of interest due to liquidity seeking behavior.
5 — Volume as Confirmation
Volume validates the structural narrative:
- Expansion into the head reflects emotional buying.
- Reduced volume into the right shoulder signals buyer exhaustion.
- Rising volume during breakdown attempts confirms seller engagement.
Price patterns without volume context should be treated as incomplete.
6 — Educational Projection (Not a Forecast)
- The illustrated path represents a common post–Head & Shoulders sequence:
- Structural breakdown from compression
- Downside acceleration
- Price seeking prior imbalance and liquidity
This projection is intended to demonstrate market tendencies rather than guarantee outcomes.
Final Thoughts
KTOS highlights several repeatable market principles:
- Trends typically end through distribution, not collapse
- Volume often signals intent before price confirms
- Market structure repeats because participant behavior repeats
- Understanding why patterns form is more valuable than memorizing the pattern itself
Trade safe. Stay objective. Let structure and volume do the talking.

Eric Thies
Feragatname
Bilgiler ve yayınlar, TradingView tarafından sağlanan veya onaylanan finansal, yatırım, alım satım veya diğer türden tavsiye veya öneriler anlamına gelmez ve teşkil etmez. Kullanım Koşulları bölümünde daha fazlasını okuyun.
Eric Thies
Feragatname
Bilgiler ve yayınlar, TradingView tarafından sağlanan veya onaylanan finansal, yatırım, alım satım veya diğer türden tavsiye veya öneriler anlamına gelmez ve teşkil etmez. Kullanım Koşulları bölümünde daha fazlasını okuyun.