
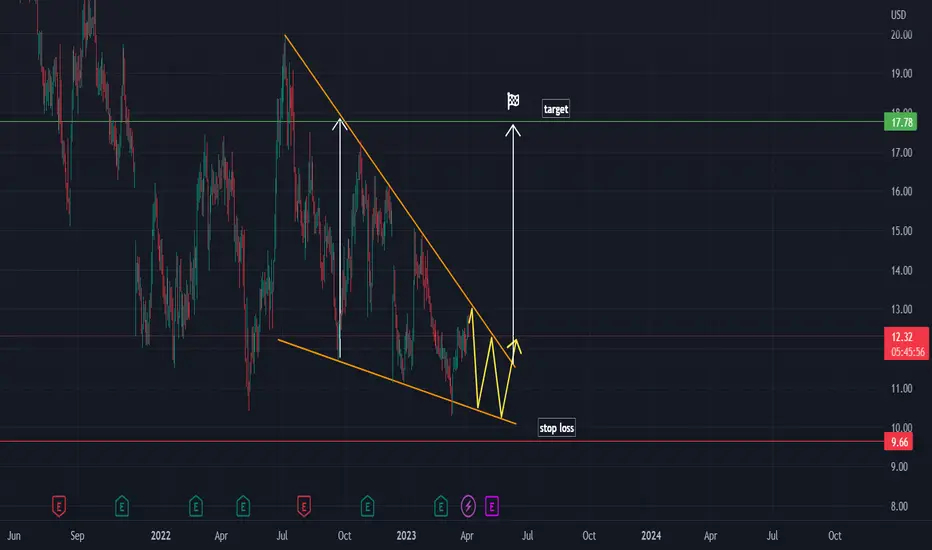
On this chart there is a falling wedge pattern.
The price is continuing to move inside the pattern.
We expect it to retest the trendline before bouncing up. Once it breaks out of the pattern it would be a good time to enter the long position.
Target and stop loss are shown on the chart.
The price is continuing to move inside the pattern.
We expect it to retest the trendline before bouncing up. Once it breaks out of the pattern it would be a good time to enter the long position.
Target and stop loss are shown on the chart.

💥 Free signals and ideas ➡ t.me/vfinvestment
Feragatname
Bilgiler ve yayınlar, TradingView tarafından sağlanan veya onaylanan finansal, yatırım, alım satım veya diğer türden tavsiye veya öneriler anlamına gelmez ve teşkil etmez. Kullanım Koşulları bölümünde daha fazlasını okuyun.
💥 Free signals and ideas ➡ t.me/vfinvestment
Feragatname
Bilgiler ve yayınlar, TradingView tarafından sağlanan veya onaylanan finansal, yatırım, alım satım veya diğer türden tavsiye veya öneriler anlamına gelmez ve teşkil etmez. Kullanım Koşulları bölümünde daha fazlasını okuyun.