
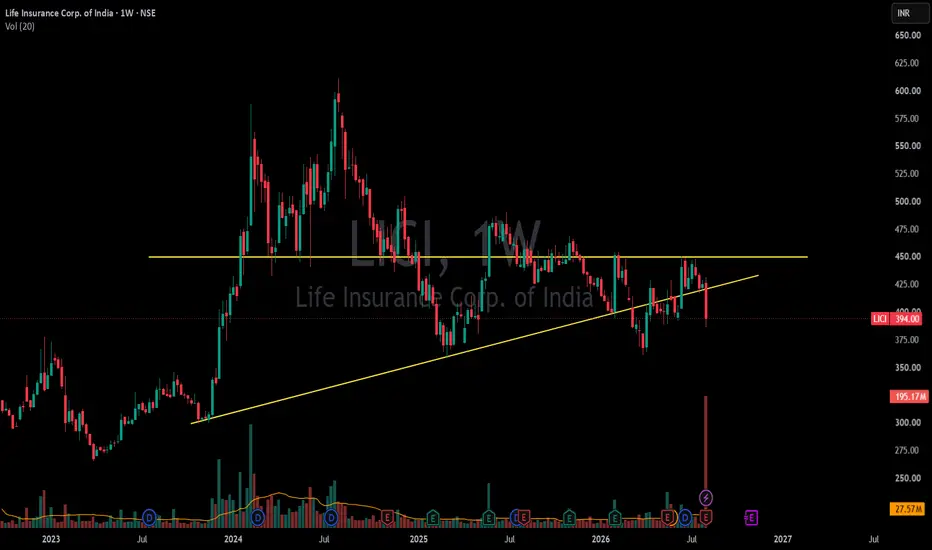
🔻 LIC — Bearish Breakdown on Weekly Timeframe
LIC is showing a significant bearish technical development on the weekly chart, with price breaking below a multi-year rising trendline.
The breakdown is accompanied by a sharp increase in volume, adding credibility to the bearish structure and suggesting a potential shift in medium-term momentum.
The stock has also failed to sustain above the ₹450 resistance zone, which has acted as a major supply area over multiple attempts.
Key Levels to Watch
Immediate Support: ₹375
Major Support: ₹350
Next Support Zone: ₹325–₹320
Major Long-Term Support: ₹300
On the upside, ₹415–₹430 becomes an important resistance/retest zone. A recovery into this area followed by rejection could strengthen the bearish setup.
Bearish Scenario
A sustained weekly close below ₹375, followed by a breakdown below ₹350 with strong volume, could open the possibility of a deeper correction toward ₹325 and potentially ₹300.
However, the ₹300 level should be treated as a technical downside zone rather than a guaranteed target. Price action around ₹350 and ₹325 will be important for confirmation.
Market View
Trend: Bearish 🔻
Structure: Rising trendline breakdown
Volume: Strong bearish confirmation
Resistance: ₹415–₹430
Major Resistance: ₹450
Support: ₹375 / ₹350 / ₹325 / ₹300
LIC has entered a critical phase. The next few weekly candles will determine whether this is merely a correction or the beginning of a larger structural decline.
LIC is showing a significant bearish technical development on the weekly chart, with price breaking below a multi-year rising trendline.
The breakdown is accompanied by a sharp increase in volume, adding credibility to the bearish structure and suggesting a potential shift in medium-term momentum.
The stock has also failed to sustain above the ₹450 resistance zone, which has acted as a major supply area over multiple attempts.
Key Levels to Watch
Immediate Support: ₹375
Major Support: ₹350
Next Support Zone: ₹325–₹320
Major Long-Term Support: ₹300
On the upside, ₹415–₹430 becomes an important resistance/retest zone. A recovery into this area followed by rejection could strengthen the bearish setup.
Bearish Scenario
A sustained weekly close below ₹375, followed by a breakdown below ₹350 with strong volume, could open the possibility of a deeper correction toward ₹325 and potentially ₹300.
However, the ₹300 level should be treated as a technical downside zone rather than a guaranteed target. Price action around ₹350 and ₹325 will be important for confirmation.
Market View
Trend: Bearish 🔻
Structure: Rising trendline breakdown
Volume: Strong bearish confirmation
Resistance: ₹415–₹430
Major Resistance: ₹450
Support: ₹375 / ₹350 / ₹325 / ₹300
LIC has entered a critical phase. The next few weekly candles will determine whether this is merely a correction or the beginning of a larger structural decline.

Feragatname
Bilgiler ve yayınlar, TradingView tarafından sağlanan veya onaylanan finansal, yatırım, alım satım veya diğer türden tavsiye veya öneriler anlamına gelmez ve teşkil etmez. Kullanım Koşulları bölümünde daha fazlasını okuyun.
Feragatname
Bilgiler ve yayınlar, TradingView tarafından sağlanan veya onaylanan finansal, yatırım, alım satım veya diğer türden tavsiye veya öneriler anlamına gelmez ve teşkil etmez. Kullanım Koşulları bölümünde daha fazlasını okuyun.