
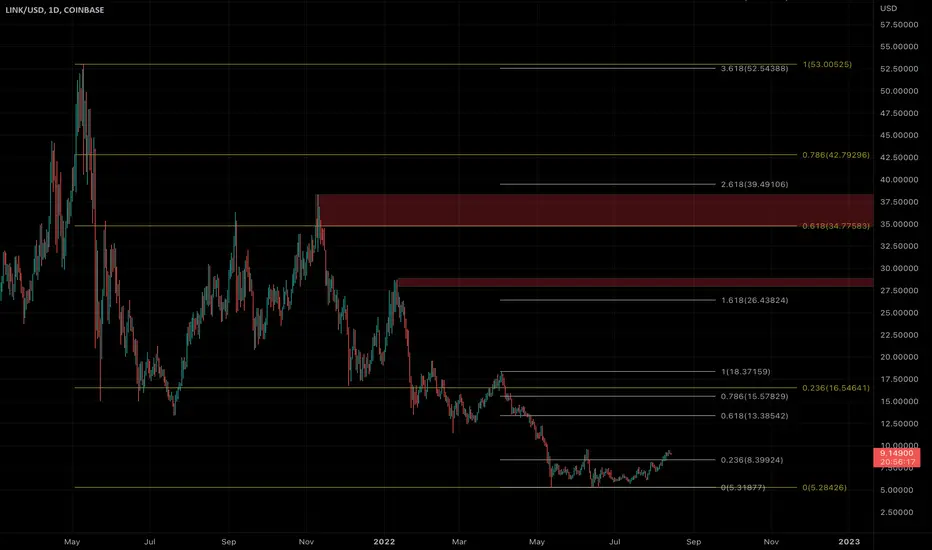
Yellow fib drawn on the weekly time frame. This is the long time frame expected targets.
White fib drawn on the daily time frame. This gives us guidance for the short term targets and possible rejection/volatile levels.
Red boxes are drawn on the daily time frame where wicks are expected to fill during the next pump.
Let me know what you think.
White fib drawn on the daily time frame. This gives us guidance for the short term targets and possible rejection/volatile levels.
Red boxes are drawn on the daily time frame where wicks are expected to fill during the next pump.
Let me know what you think.

Feragatname
Bilgiler ve yayınlar, TradingView tarafından sağlanan veya onaylanan finansal, yatırım, alım satım veya diğer türden tavsiye veya öneriler anlamına gelmez ve teşkil etmez. Kullanım Koşulları bölümünde daha fazlasını okuyun.
Feragatname
Bilgiler ve yayınlar, TradingView tarafından sağlanan veya onaylanan finansal, yatırım, alım satım veya diğer türden tavsiye veya öneriler anlamına gelmez ve teşkil etmez. Kullanım Koşulları bölümünde daha fazlasını okuyun.