
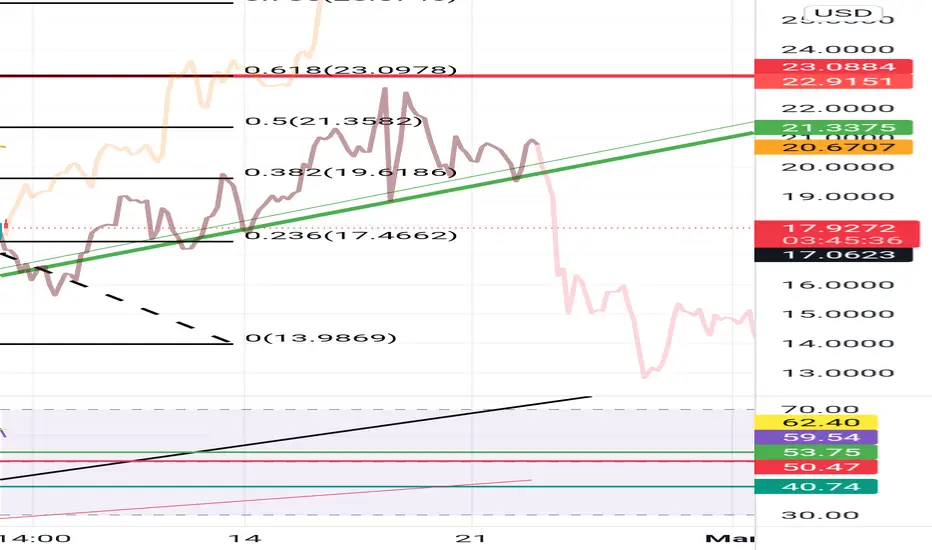
This will chart chainlinks performance on a 4 hour chart
The orange line represents the highs 200 days ago today and the black line represents the highs 100 days ago today.
I placed them along the current highs as of 1500 hours today. This is just done out of morbid curiosity.
The orange line represents the highs 200 days ago today and the black line represents the highs 100 days ago today.
I placed them along the current highs as of 1500 hours today. This is just done out of morbid curiosity.

Feragatname
Bilgiler ve yayınlar, TradingView tarafından sağlanan veya onaylanan finansal, yatırım, alım satım veya diğer türden tavsiye veya öneriler anlamına gelmez ve teşkil etmez. Kullanım Koşulları bölümünde daha fazlasını okuyun.
Feragatname
Bilgiler ve yayınlar, TradingView tarafından sağlanan veya onaylanan finansal, yatırım, alım satım veya diğer türden tavsiye veya öneriler anlamına gelmez ve teşkil etmez. Kullanım Koşulları bölümünde daha fazlasını okuyun.