
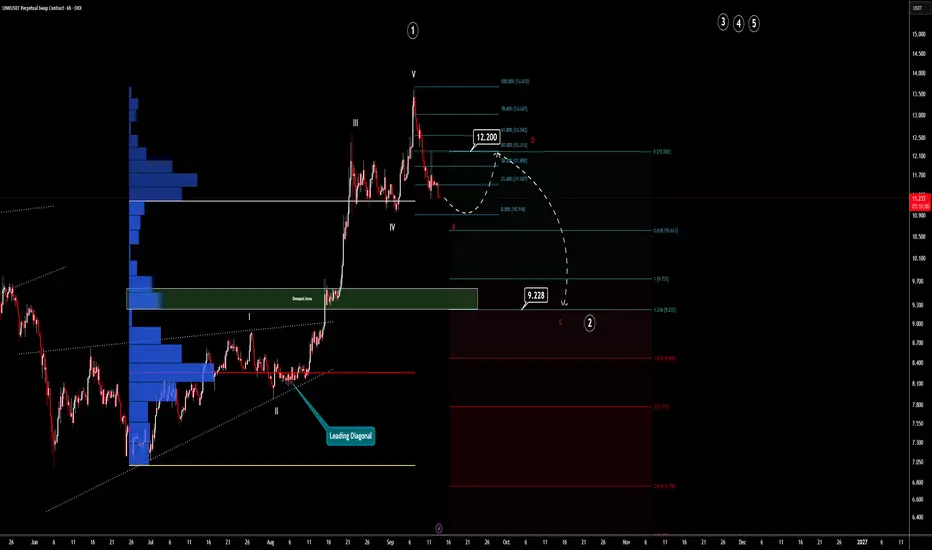
Chainlink shows a clear sign that an inner impulsive move is coming to an end.
This chart shows a clear textbook illustration of Elliott Wave analysis.
After forming the diagonal, an impulsive move has ended. Now is the time for an A-B-C correction, and that small correction is going to create a wave 2 move on the daily timeframe.
If we consider the Fed + BOJ rate decisions in the coming days, this chart makes even more sense.
No need for complicated explanations. First down, then up. Simple as that.
This chart shows a clear textbook illustration of Elliott Wave analysis.
After forming the diagonal, an impulsive move has ended. Now is the time for an A-B-C correction, and that small correction is going to create a wave 2 move on the daily timeframe.
If we consider the Fed + BOJ rate decisions in the coming days, this chart makes even more sense.
No need for complicated explanations. First down, then up. Simple as that.
İşlem kapandı: hedefe ulaştı
Link has reached its wave B target, do not try to short anything, market is bullish. Analysis might be invalidated easily.
Feragatname
Bilgiler ve yayınlar, TradingView tarafından sağlanan veya onaylanan finansal, yatırım, alım satım veya diğer türden tavsiye veya öneriler anlamına gelmez ve teşkil etmez. Kullanım Koşulları bölümünde daha fazlasını okuyun.
Feragatname
Bilgiler ve yayınlar, TradingView tarafından sağlanan veya onaylanan finansal, yatırım, alım satım veya diğer türden tavsiye veya öneriler anlamına gelmez ve teşkil etmez. Kullanım Koşulları bölümünde daha fazlasını okuyun.