Alış
LRCUSDT - Dailly analysis
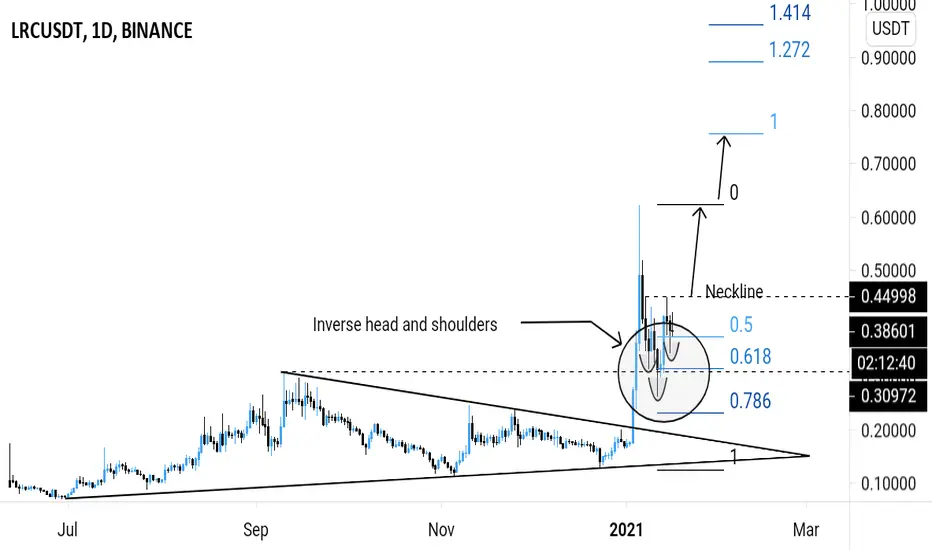
LRCUSDT brokeout above the symmetrical triangle pattern as expected from my previous analysis.
Price hit the ATH and retraced.
Price is testing the flip horizontal support + 0.618 fibonacci retracement level.
A bullish pin bar ( hammer ) was formed on the Daily timeframe.
Price action is printing the inverse head and shoulders reversal pattern.
Possible uptrend continuation.
Buy entry ⬆️ - breakout above the inverse head and shoulders neckline resistance.
Targets 🎯 - previous swing high (ATH), fibonacci extension levels.
Setup invalidation ❌ - breakdown below the inverse shoulders support level.
Price hit the ATH and retraced.
Price is testing the flip horizontal support + 0.618 fibonacci retracement level.
A bullish pin bar ( hammer ) was formed on the Daily timeframe.
Price action is printing the inverse head and shoulders reversal pattern.
Possible uptrend continuation.
Buy entry ⬆️ - breakout above the inverse head and shoulders neckline resistance.
Targets 🎯 - previous swing high (ATH), fibonacci extension levels.
Setup invalidation ❌ - breakdown below the inverse shoulders support level.

İlgili yayınlar
Feragatname
Bilgiler ve yayınlar, TradingView tarafından sağlanan veya onaylanan finansal, yatırım, alım satım veya diğer türden tavsiye veya öneriler anlamına gelmez ve teşkil etmez. Kullanım Koşulları bölümünde daha fazlasını okuyun.
İlgili yayınlar
Feragatname
Bilgiler ve yayınlar, TradingView tarafından sağlanan veya onaylanan finansal, yatırım, alım satım veya diğer türden tavsiye veya öneriler anlamına gelmez ve teşkil etmez. Kullanım Koşulları bölümünde daha fazlasını okuyun.